
From Zero to Insights: Dive into GA4
March 21, 2025
Discover what your website is trying to tell you with Google Analytics 4 (GA4) so you can be more informed about website traffic and make better data-driven decisions.
Marketing and technology change so often it sometimes feels like just when you finally have a grasp on your tools something changes. You’re now having to scramble to understand the new features. At least that’s how a lot of us felt when Google said we had to move from Universal Analytics to GA4.
What doesn’t often change are the core concepts and that’s what I want to cover and help you understand. Find a cozy spot, sip your favorite beverage (coffee for me) and let’s dig in!
TLDR
- Google Analytics (GA4) is a free analytics tool and a better way to track user interactions across websites and apps than the previous Universal Analytics version.
- Instead of using session data like Universal Analytics, GA4 uses events to track website interactions.
- Use GA4 and Google Tag Manager (GTM) to track things like what users are searching for on your site, segment audiences, unique engagements, and track important actions like form submissions.
- There are a couple of ways to set up GA4 on your website. I prefer using GTM, but do what works best for you.
Here’s what we’ll cover
- Introduction to Google Analytics 4
- Setup and Installation
- Understanding Reports
- Event Tracking
- GA4 Use Cases
- Start Tracking with GA4
Introduction to Google Analytics 4
What is Google Analytics and how do you use it?
GA4 is a free analytics tool that helps you track performance, user behaviour, and a number of other data points that happen on your website.
- Want to know how many users visited your blog?
- How long did they spend on that one article?
- How many people signed up for our newsletter?
You can answer all these questions and more. It’s worth noting there’s an enterprise version for large businesses. I’ve seen conflicting price points online so the best bet is to review the Google Marketing Platform’s page about Analytics 360 and contact sales.
Setup and Installation
Part 1: Create a Google Analytics Account
When you’re ready, go to the Google Marketing Platform analytics page.
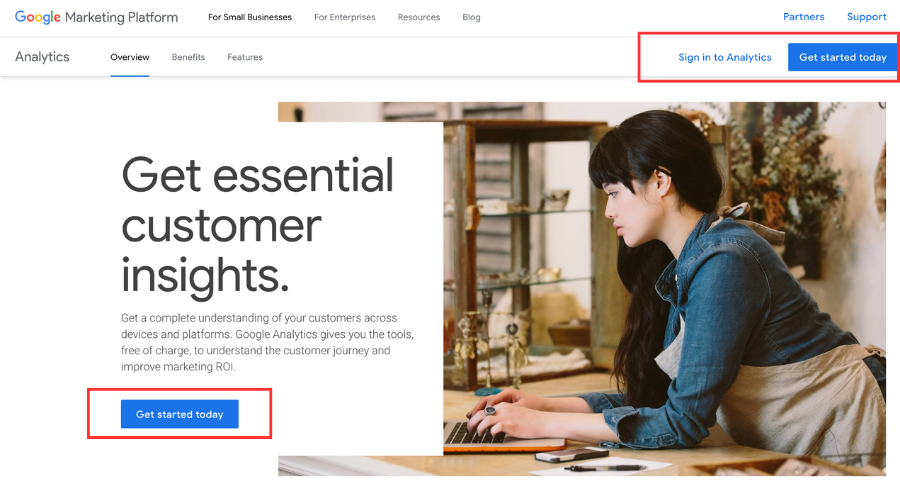
A quick explanation about what you’re looking at.
- Get started today (Navbar) – If you’re already signed into the Google account you want to have associated with your GA4 account, then you can click the “Get started today” and it will take you straight to the analytics dashboard.
- Sign in to Analytics – You can click this button if you already have a profile setup.
- Get started today (On Page) – Look under the headline “Get essential customer insights” and you’ll see this button. Same button text as the one in the navbar but sends you to a page that helps you create an account.
We’re going to start by clicking the “Get started today” button in the navbar.
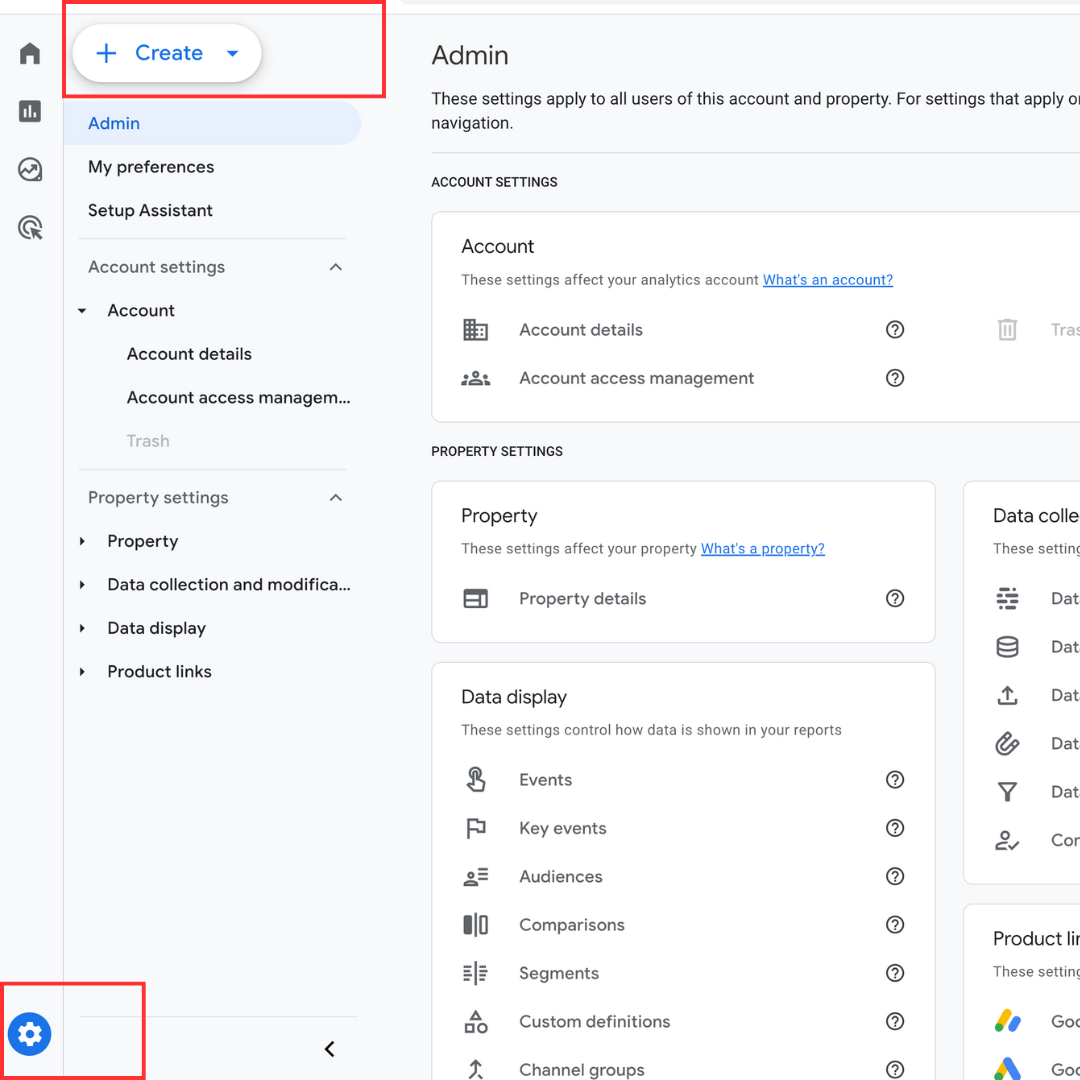
Next, if it’s your first time logging in, you might be asked about your email preferences. After that, click on Admin (gear icon) at the bottom left. Then, click the create button.
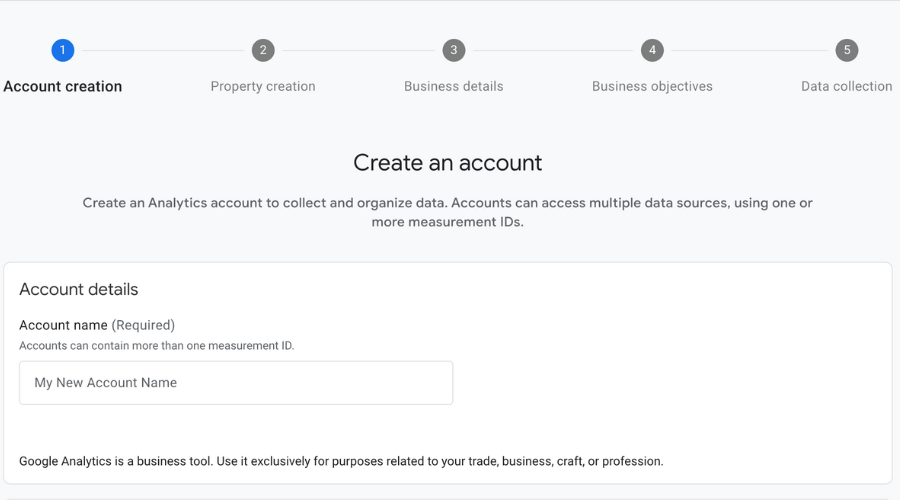
At this point, you’ll see a screen that asks you to Create an account which will contain your property or multiple properties. It’s typically recommended that you use your business name.
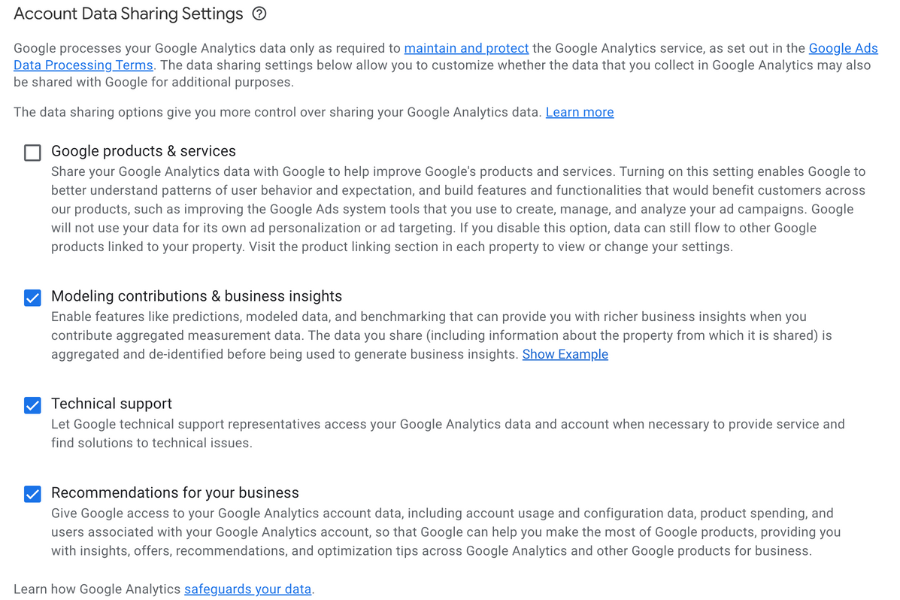
The Account Data Sharing Settings section allows you to adjust how you want to share data with Google. After reviewing, click next.
Part 2: Create a property
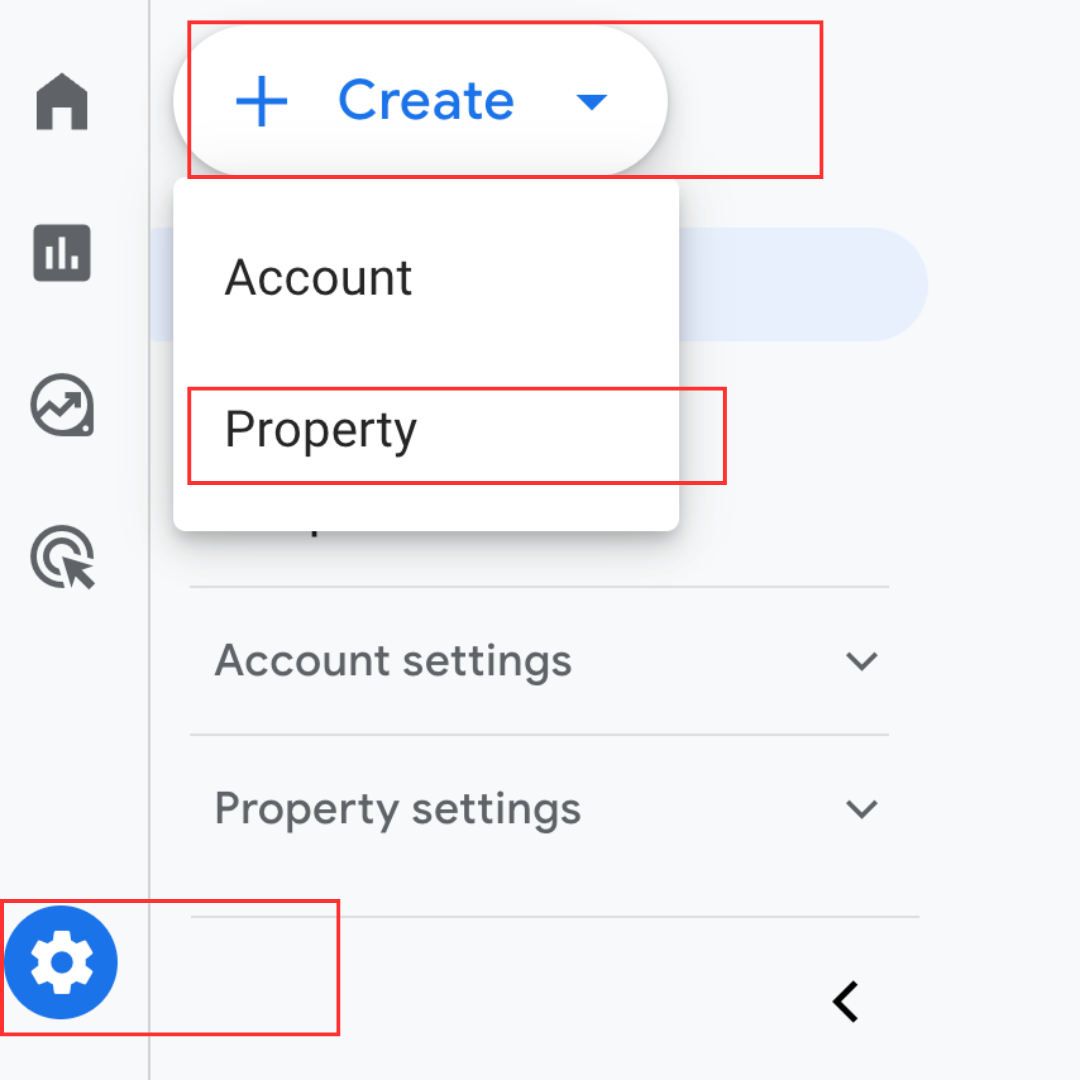
Now we need to create a property. Click Admin, click Create, and then click Property.
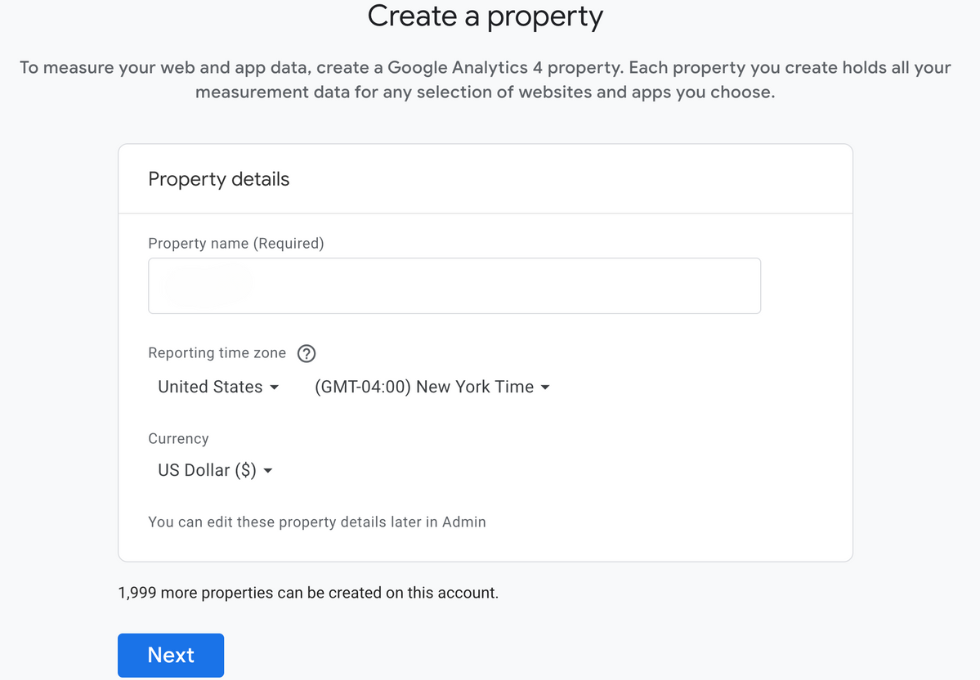
Your property name could be your business name, website, a unique identifier/internal naming convention, etc.
Next, pick your reporting time zone and currency. Choosing the right time zone is critical for accurate data reporting, especially time-sensitive data. When you’re done, click next.
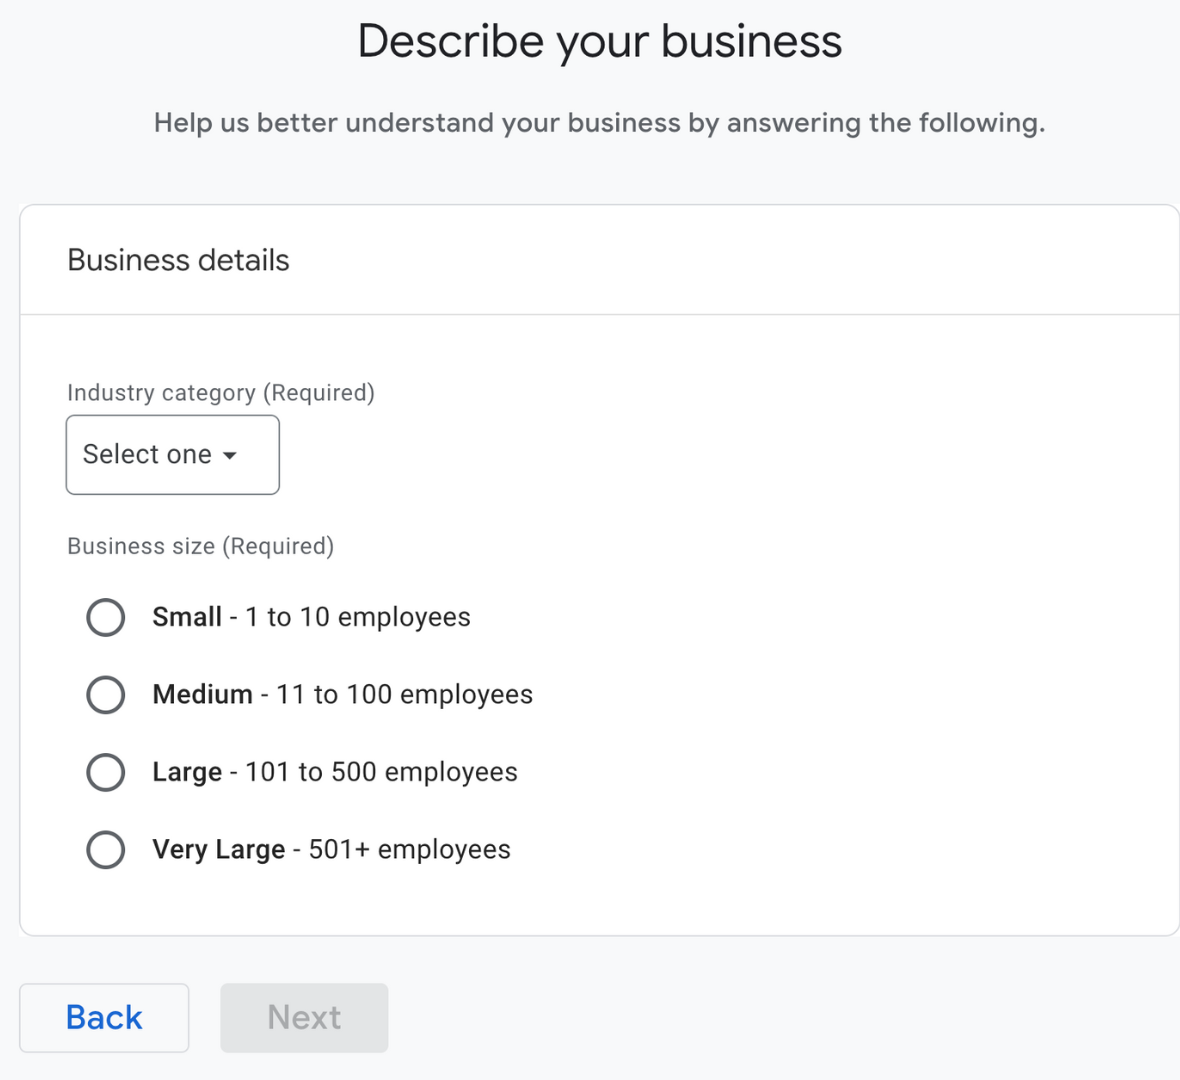
Select the category that most closely aligns with your business and then select the appropriate business size. Once you’re finished, click next.
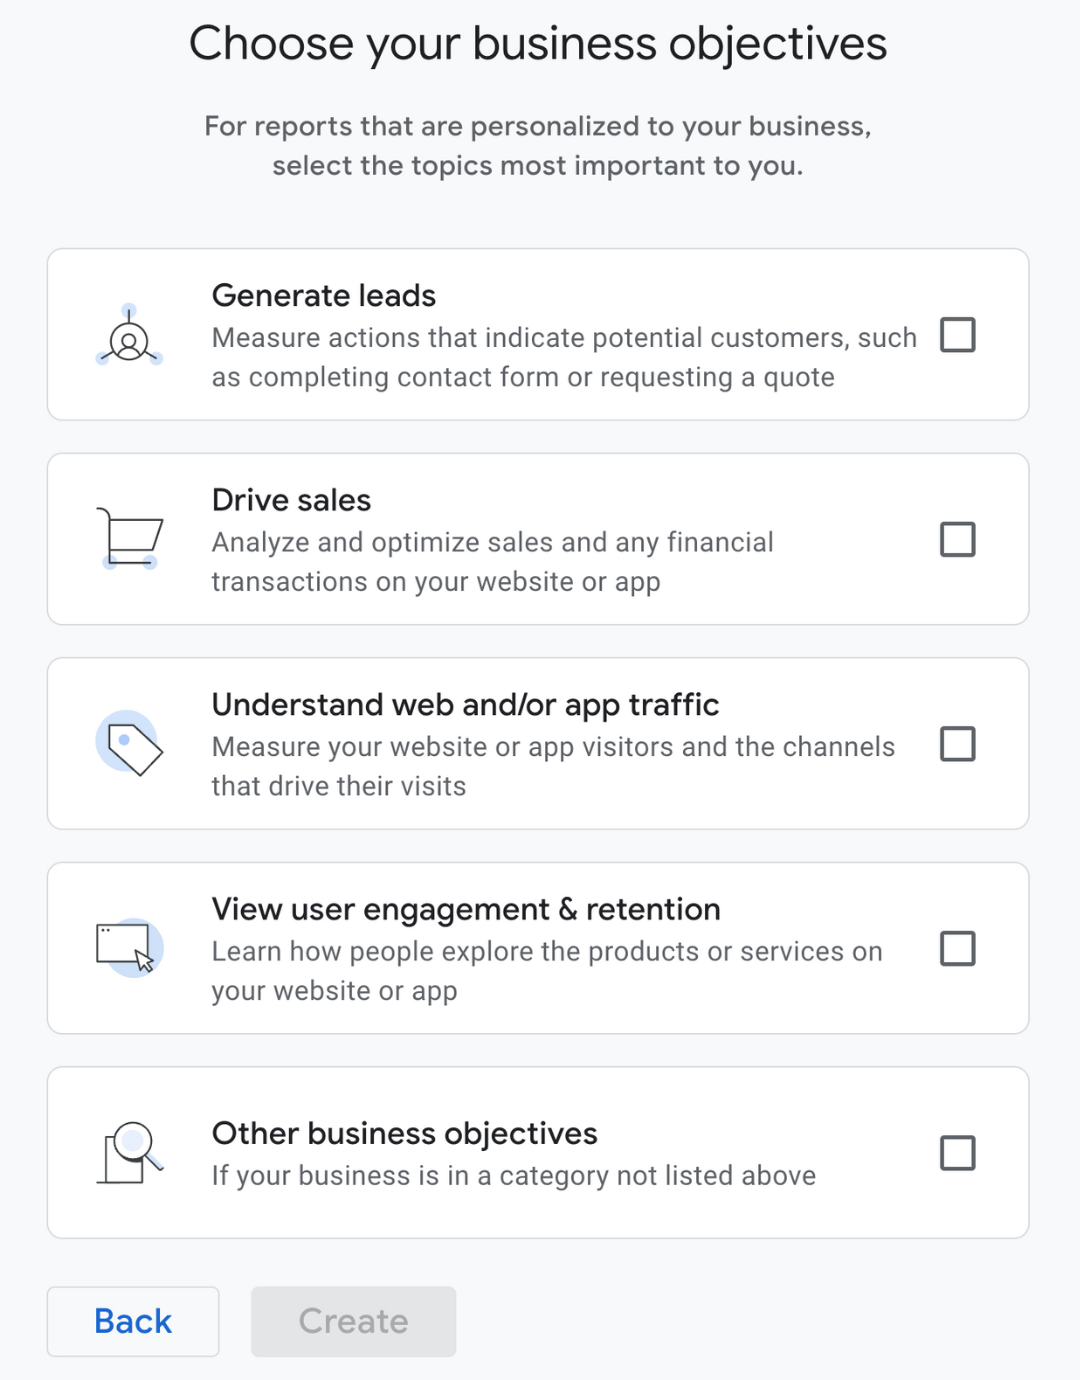
Now we’ll need to pick a business objective. Whatever you choose will determine the reports you see in the interface. When you’re ready, click Create.
FYI: One account can have multiple properties. For example, if your company has three websites (clothing, electronics, homegoods), you can create a property for each under your existing GA4 account. This helps keep the data separate, allows for individual reporting for each site, and keeps everything organized under one central account.
Part 3: Set up Your Data Stream
You created your account, built your property, but there’s no data flowing in until you set up your data stream.
Think of your new GA4 property as a reservoir and the data stream is a river or stream flowing into it. The river (data stream) brings in data from a source (website or app) and the reservoir (GA4 property) holds all of the water (data).
For our example, we’re going to choose Web.
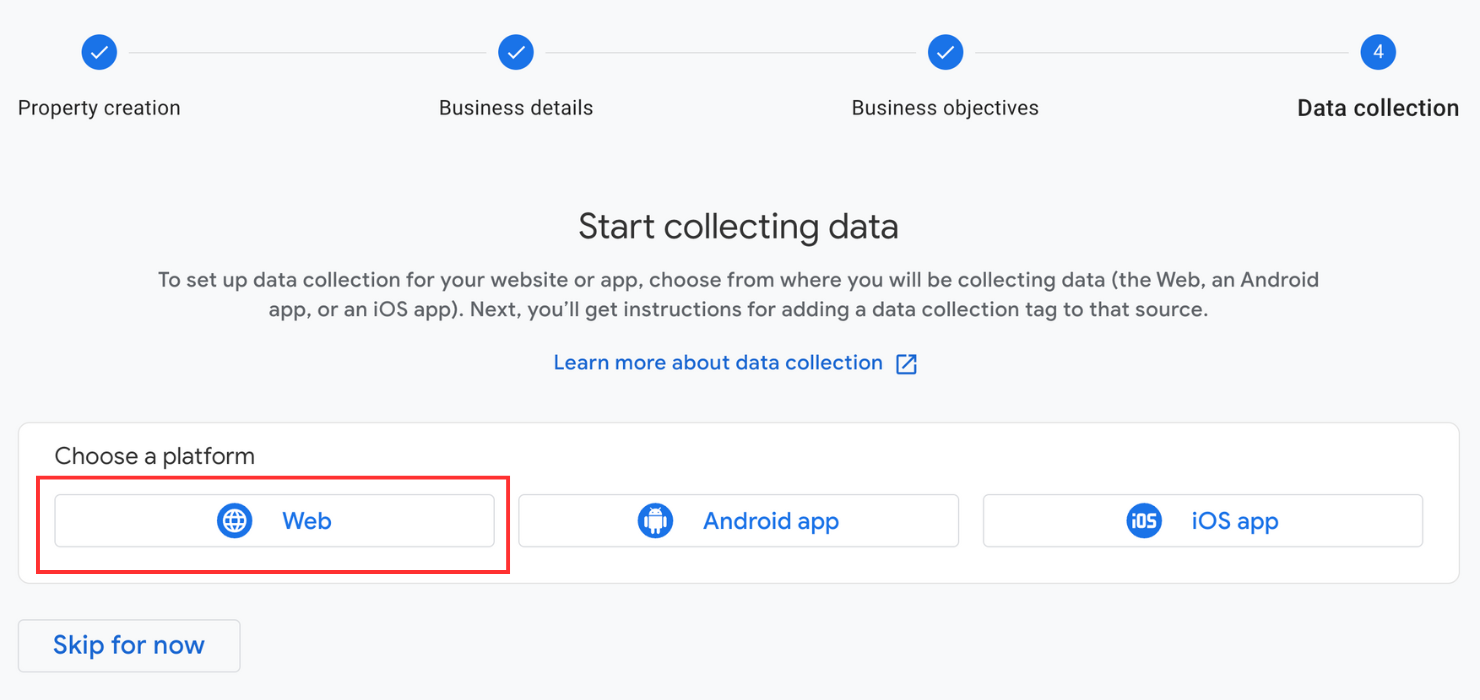
FYI: You can have multiple data sources in a single property. You could have a website, Android app, and IOS app that track events across these different platforms. Most of the time a single property for a website is going to be enough.
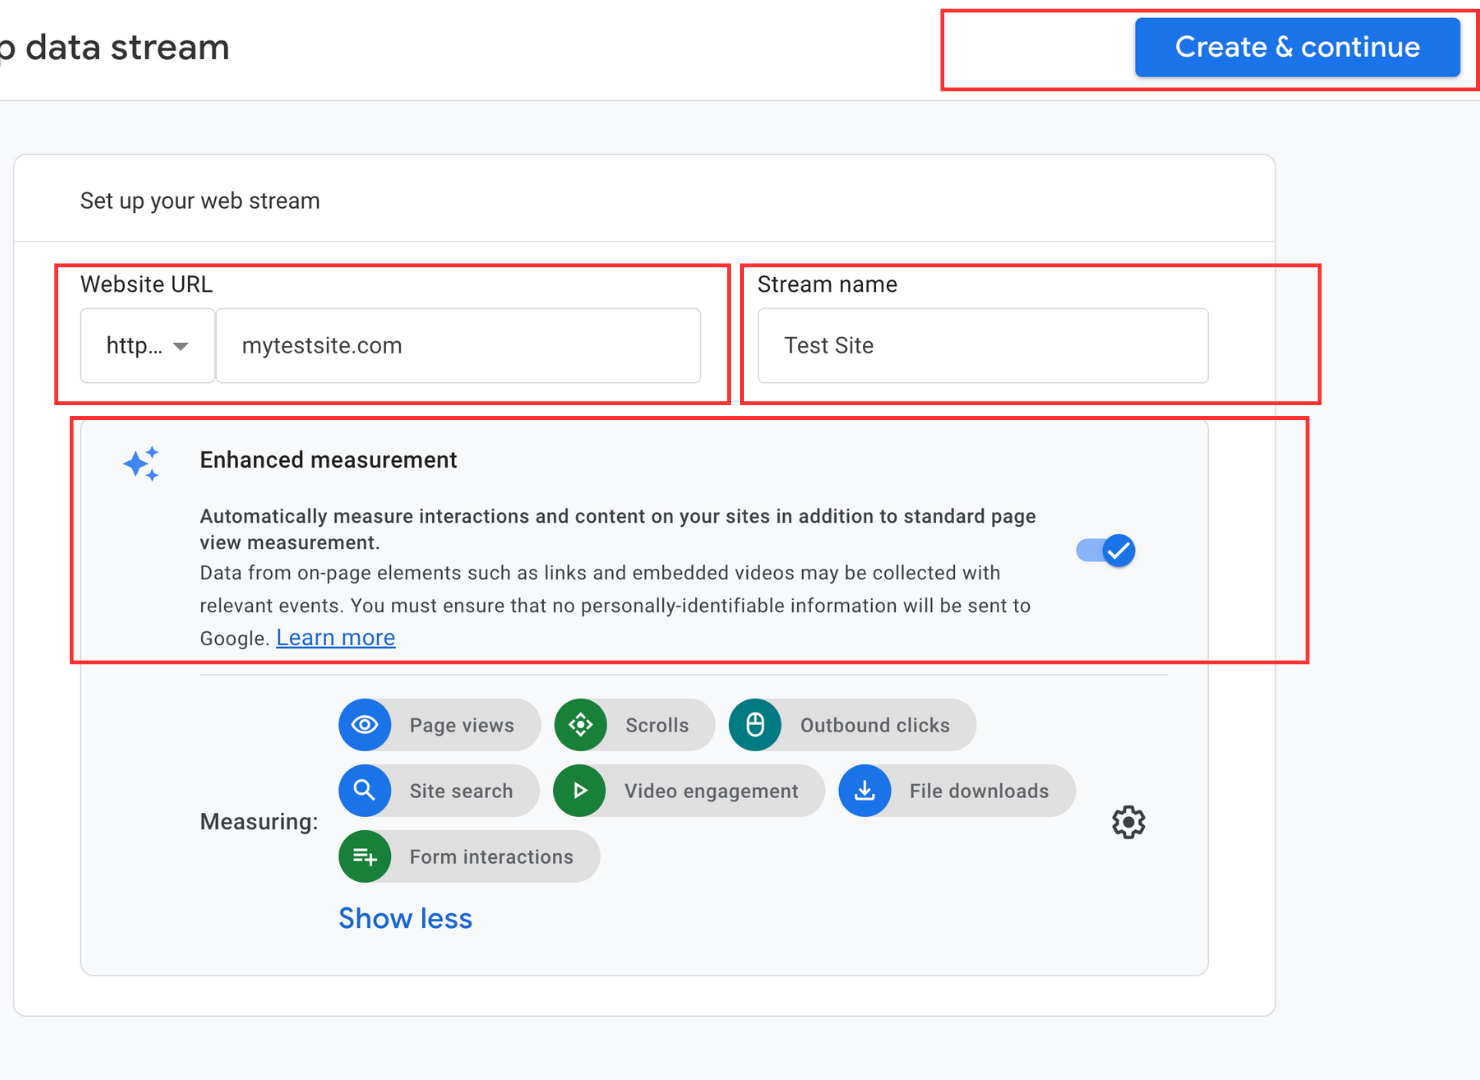
Now you’ll need to:
- Add your website’s URL
- Create a stream name
- Make sure Enhanced Measurement is turned on. Gives you a number of event tracking reports out of the box without needing a developer or doing custom work on your own.
- Click Create & continue
You’ve got your account, property, data stream, and now you’re ready to install Google Analytics on your website.
Part 4: Install Google Analytics on Your Website
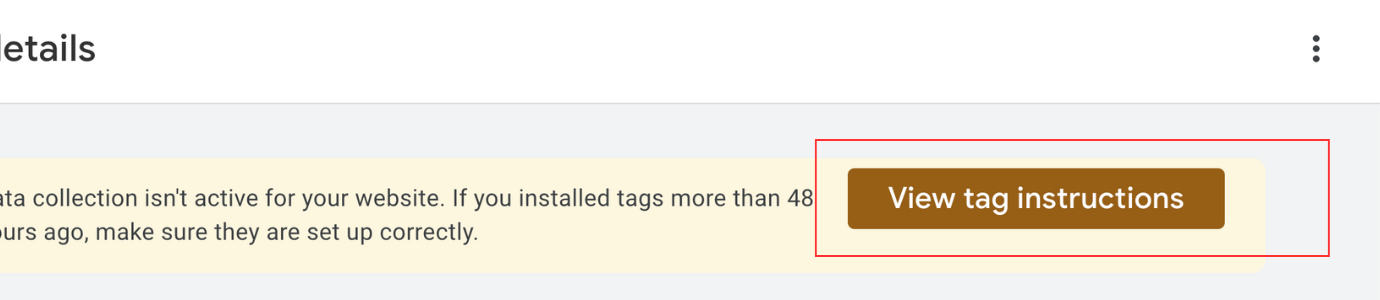
When you’re done creating your property you’ll see details about your data stream. At the top, click the View tag instructions.
On this screen, Google Analytics will automatically try to recognize what platform you’re using for your website. You can also select your platform by clicking the pencil icon.
You have three options:
- Use the Install with a website builder or CMS option which uses a plugin.
- Manually copy and paste the code immediately after the <head> element in your code.
- Install GA4 with Google Tag Manager
For our example, we’re going to use Google Tag Manager (GTM).
If you don’t already have an account you’ll need to set one up. This tutorial won’t cover the basics of GTM, instead we’re going to only focus on using GTM to set up GA4.
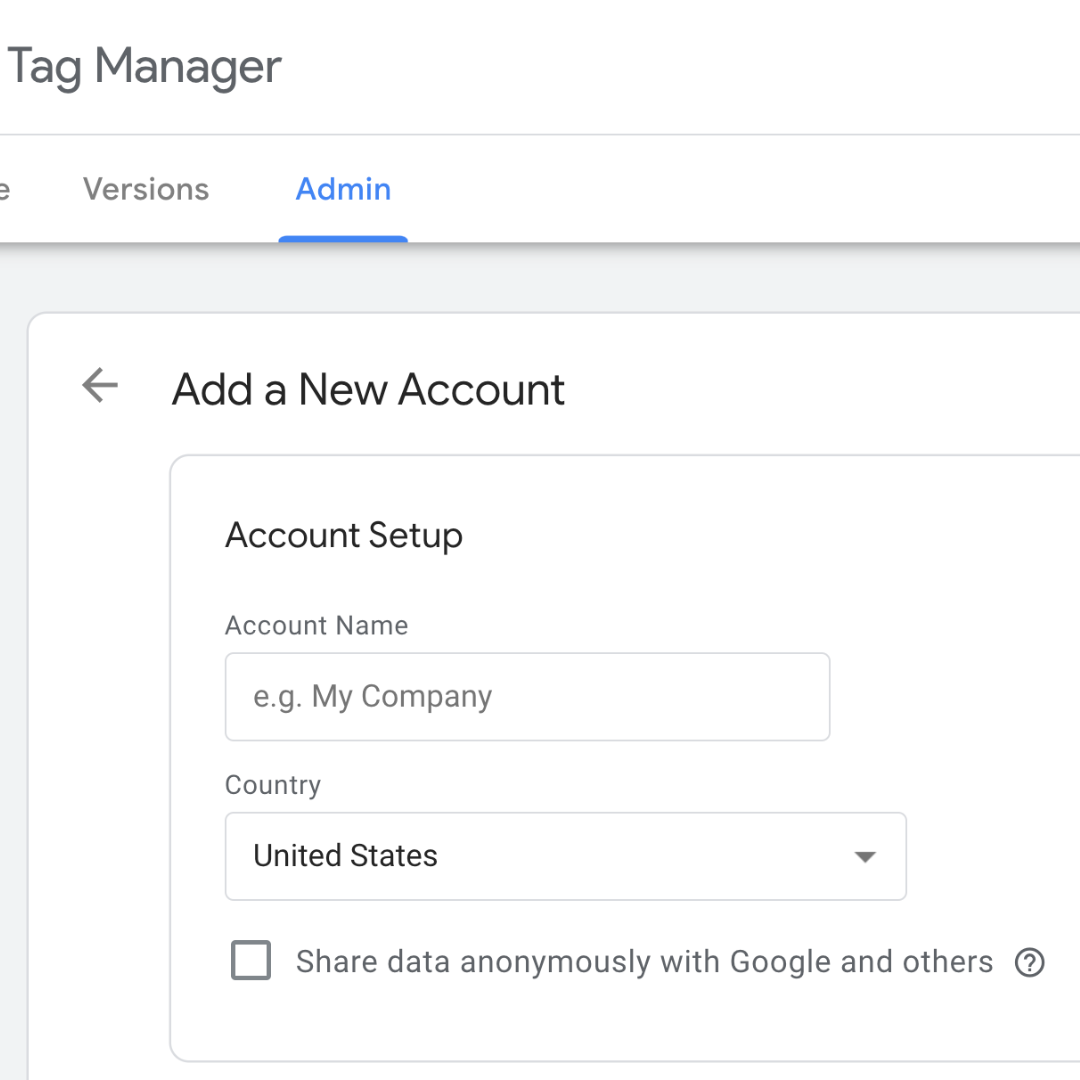
Go to tagmanager.google.com and create a new account. Then add an account name and country.
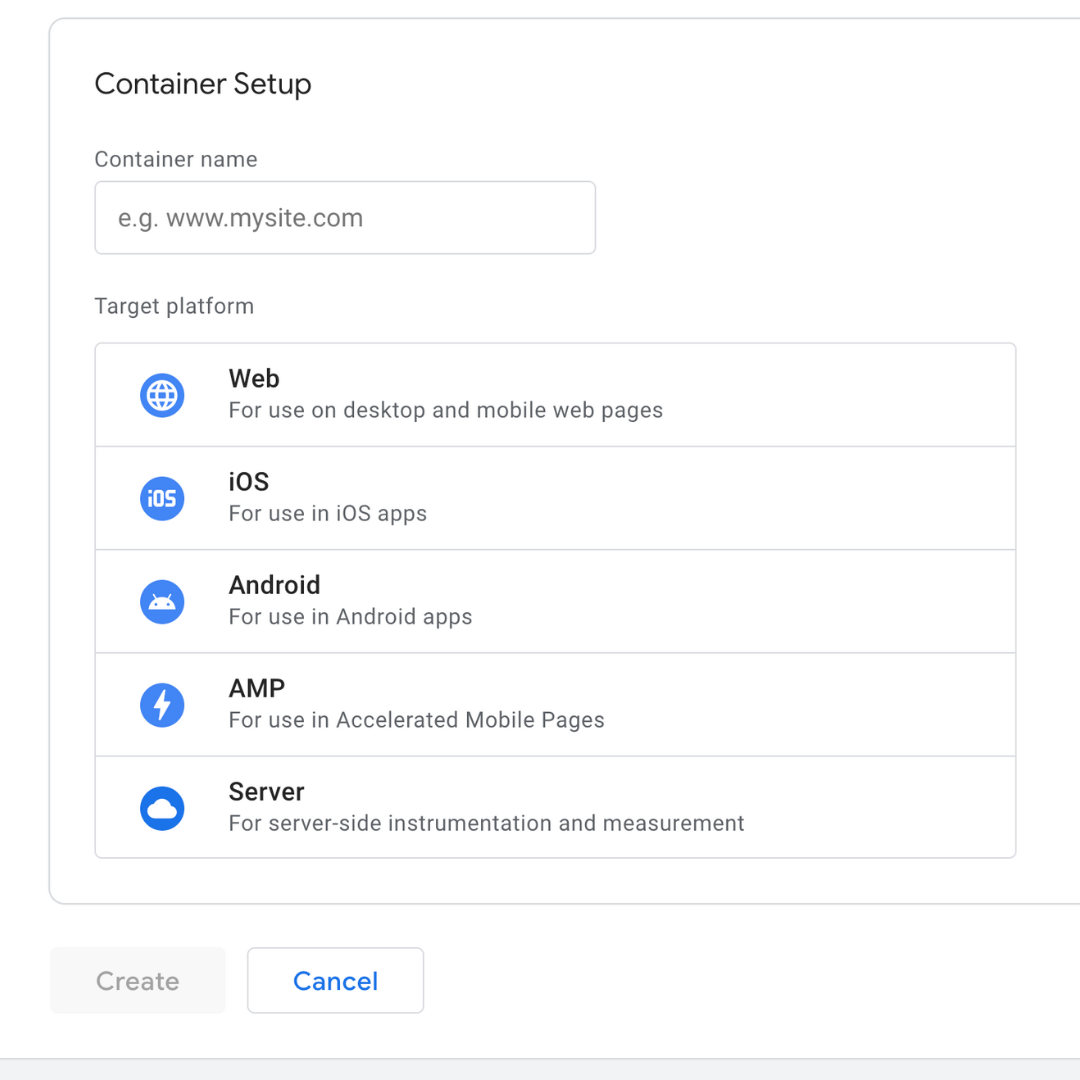
Next, set up your container by adding a Container name, your target platform (we’ll choose Web), and when you’re ready click Create.
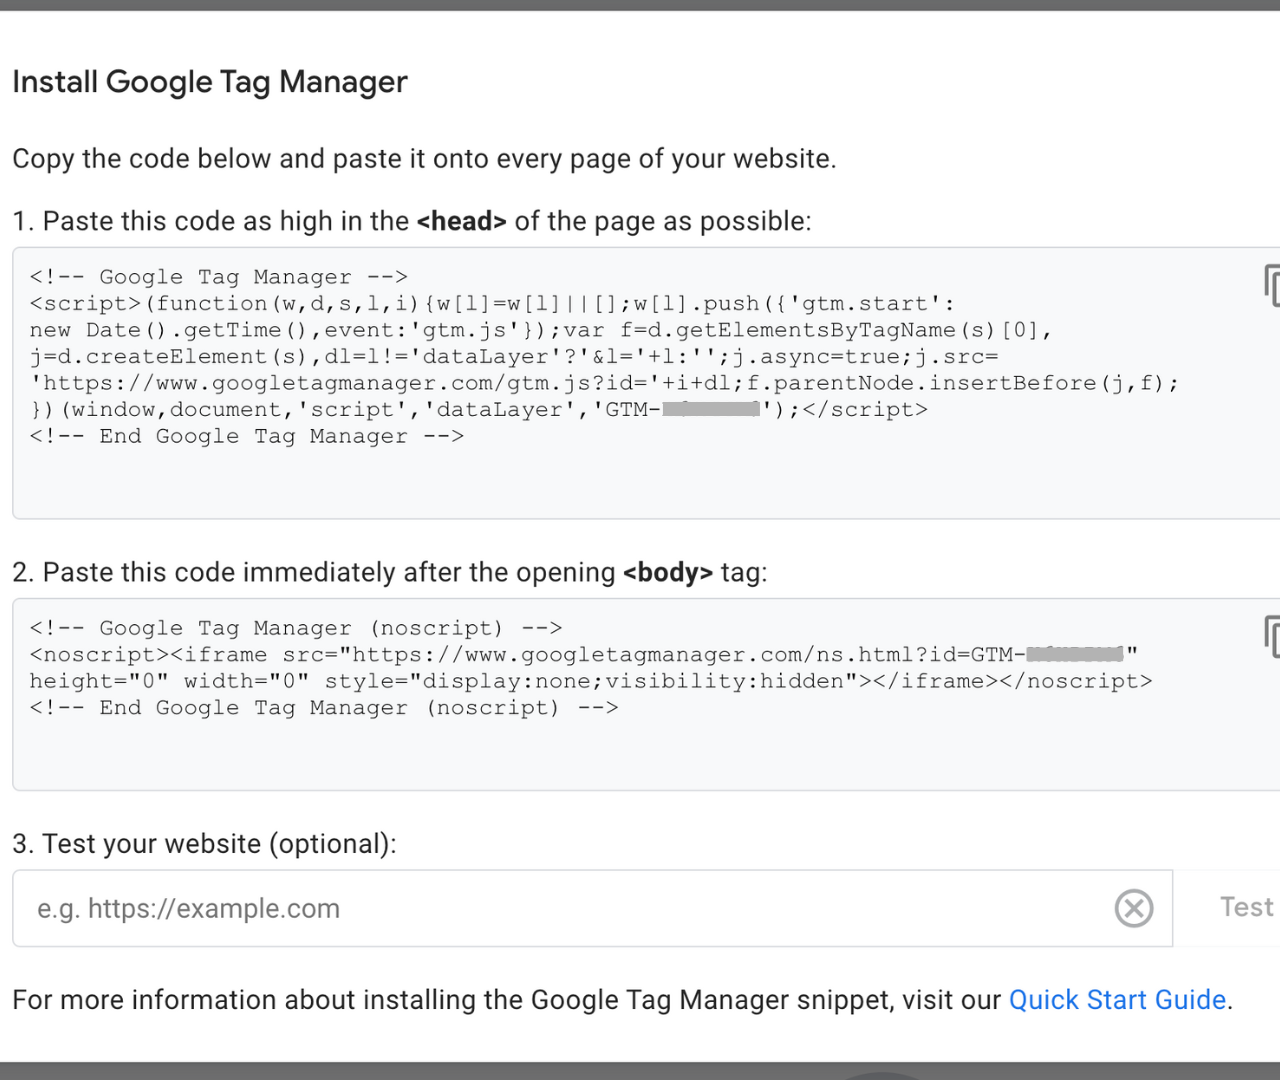
Now that you’ve created your GTM account and set up your container, you need to add GTM to your website’s code. You can either do this yourself by following the instructions or have a developer help you.
You’ll need to copy the first code snippet and paste it in the <head> tag. Then, you’ll need to copy and paste the second code snippet right after the opening <body> tag.
For more information, you can use the official Quick Start guide.
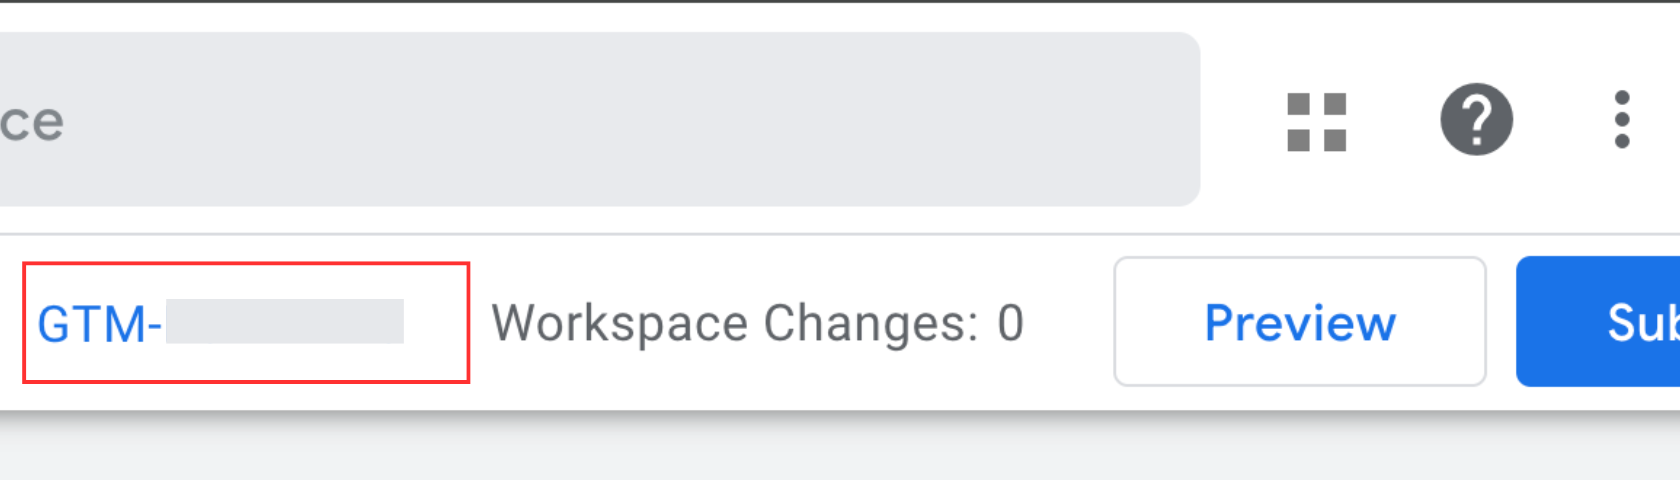
FYI: You can always find your code snippet at the top right next to where it says Workspace Changes.
Go to your Google Tag Manager Account and follow these steps.
- Click Tags on the left side
- Click New
- Click Tag Configuration
- Click Google Tag
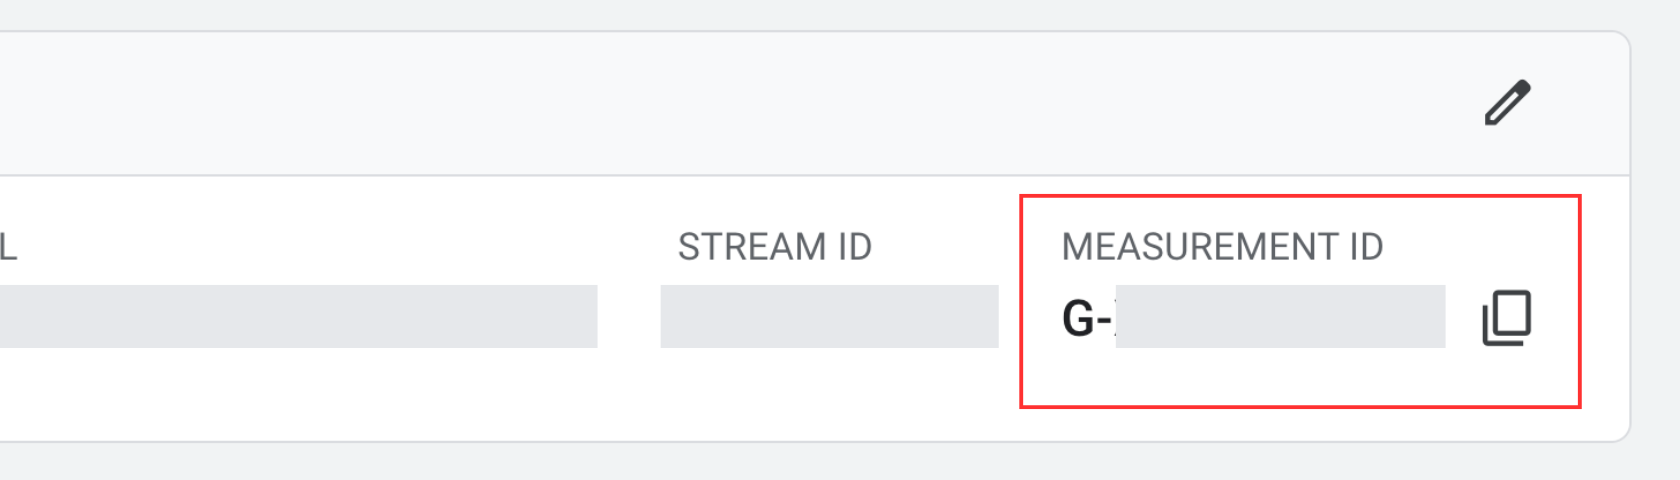
You’ll need to copy and paste your Measurement ID from your data stream. To find the ID follow these steps.
- Go to your Google Analytics account
- Click Admin
- Click Data stream under “Data collection and modification”
- Click your data stream
- At the top you’ll see Stream details and within that section you’ll see the Measurement ID that you’ll need to copy
Now paste your Measurement ID into the field that says Tag ID in Google Tag Manager. Select Initialization - All Pages and name the tag whatever you’d like. For example, I’ve named it Google Tag.

Almost there! Let’s test to make sure everything works.
We’re going to make sure this is working with both Google Tag manager and Google Analytics. We’ll use the GTM Preview mode and the GA4 Debug Mode to ensure everything is set up properly.
For real-time debugging and validation, I like to keep Google Tag Manager, the site preview, and the Google Analytics DebugView simultaneously visible. So I might use one screen or multiple screens to do this, but it’s totally up to you.
- In Google Analytics, go to Admin and click DebugView. Once that’s running, move to step 2.
- In GTM, click the Preview button at the top right corner of GTM
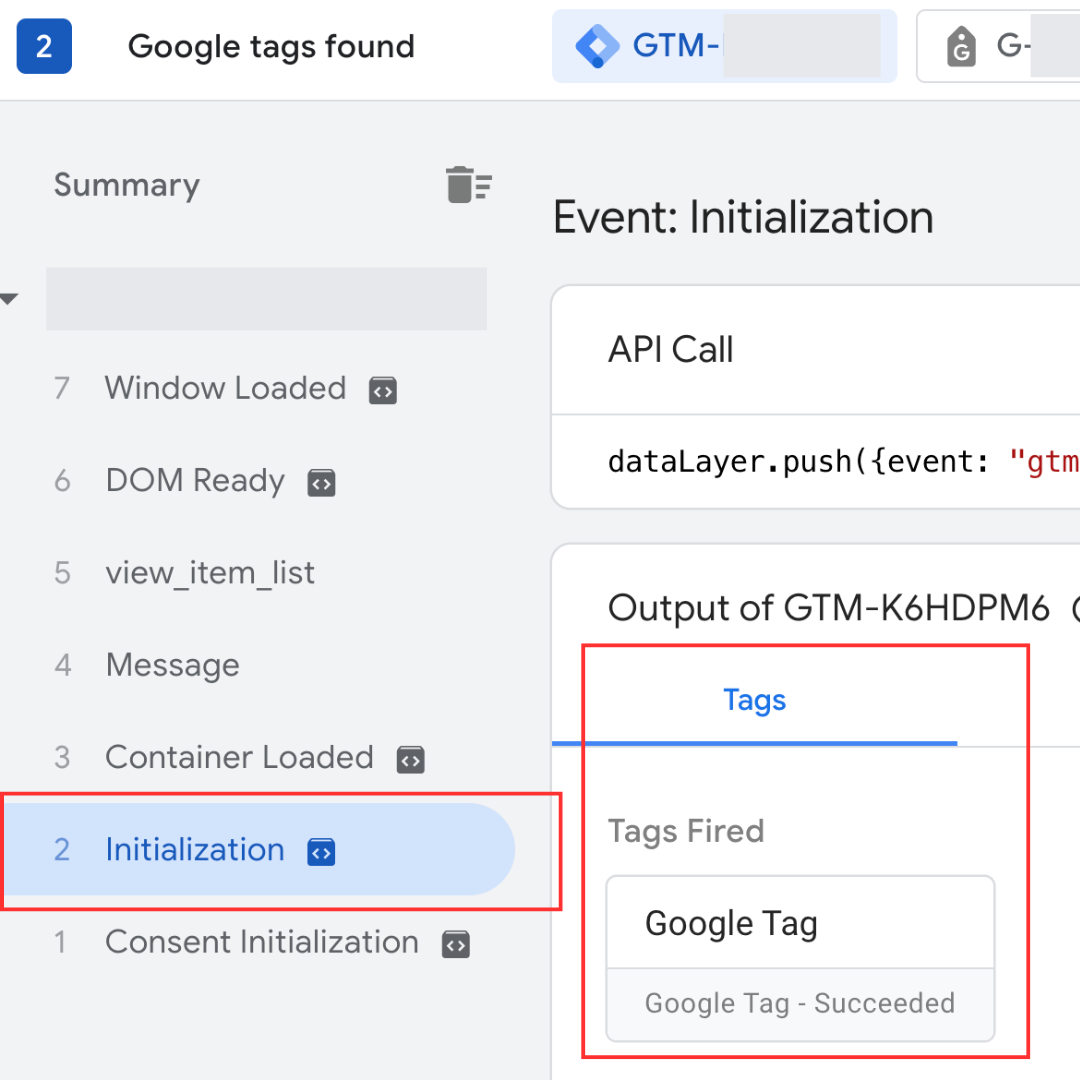
When the GTM preview mode is live you should see your Initialization tag was fired. You should also see a pageview event in your GA4 DebugView.
Google Tag Manager
Google Analytics 4 DebugView
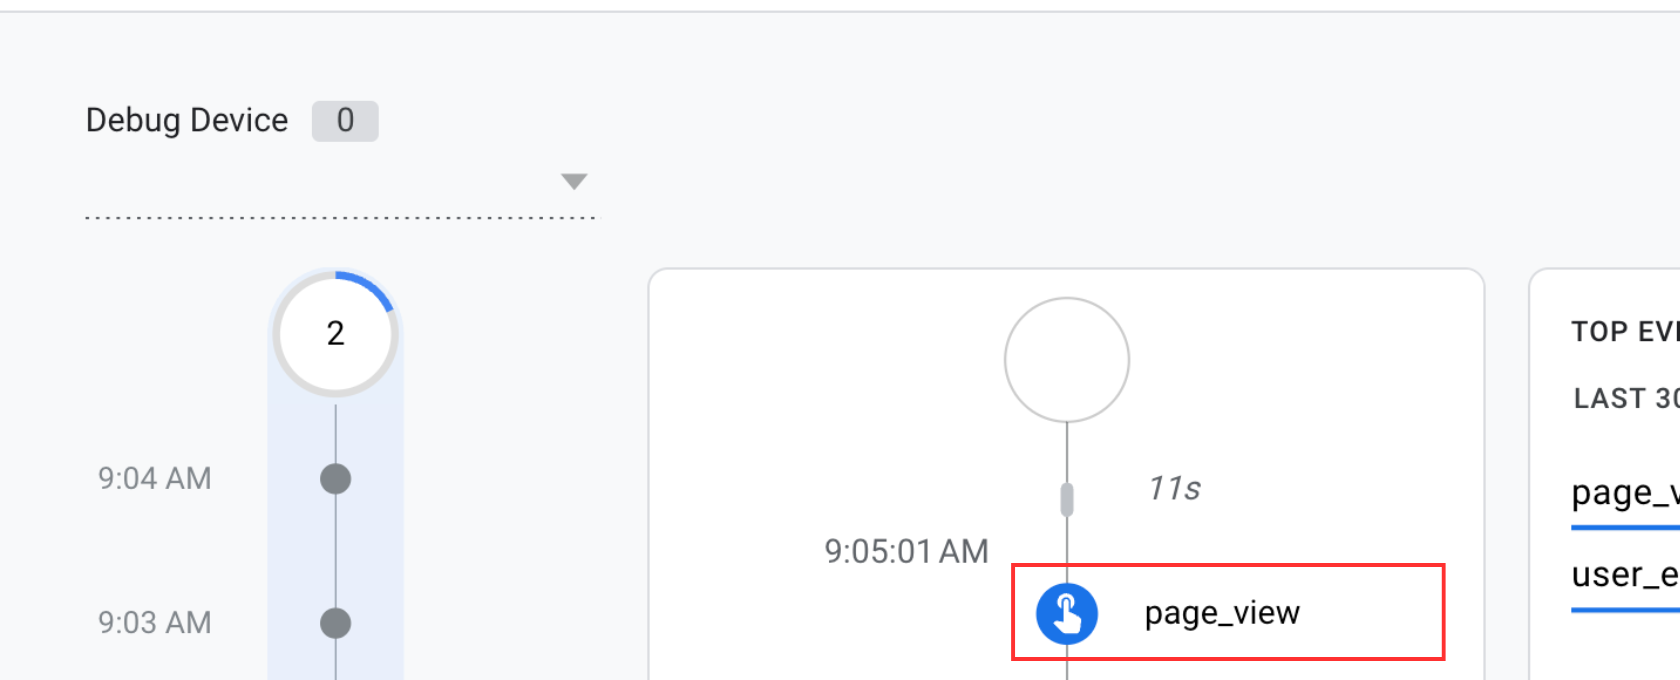
If you click page_view it will list a bunch of parameters with additional information about the event. You can click page_location to double check it’s pulling in the correct page. You can spot check another page or two to make sure everything looks good to you.
Once you’ve confirmed your data is being pulled into Google Analytics, you’ll need to submit your updates. Go to GTM and click Submit.
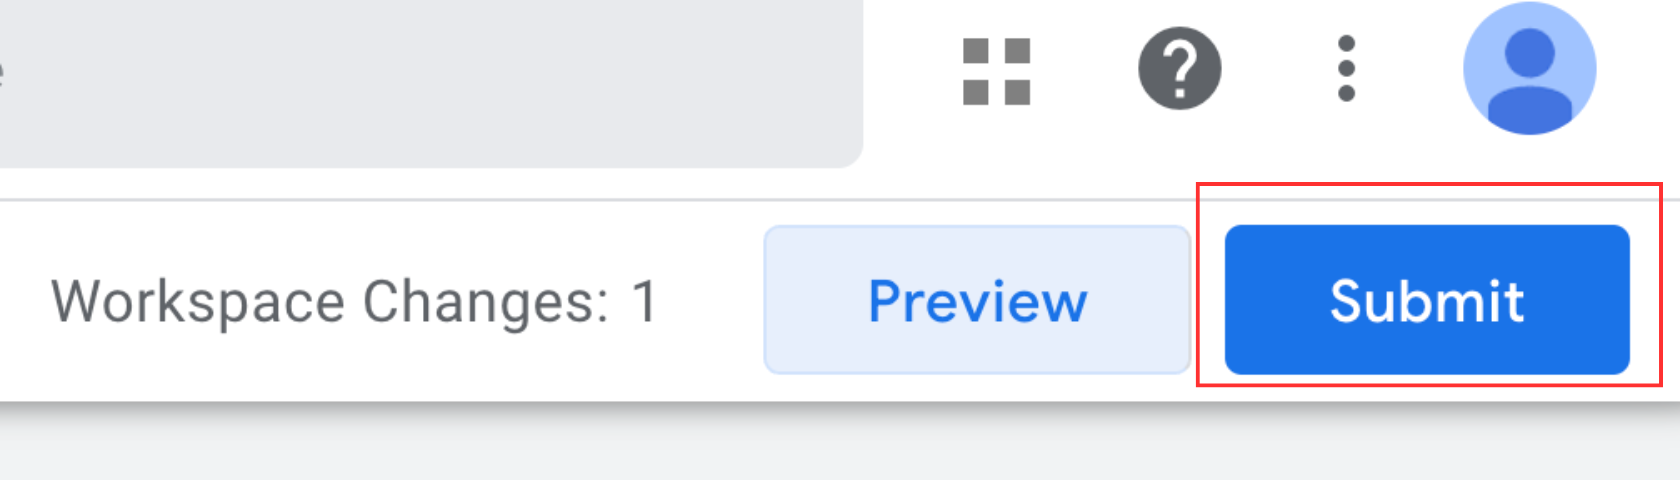
I like to give each version a name and description. That way I know what was changed/updated and so does anyone else on my team. Another benefit is if something goes wrong in a future implementation, you can rollback to a previous version so having a good naming structure in place can be helpful.
Congratulations! You have GA4 and GTM set up and you’re ready to start working with your data. In the next section, we’ll cover reporting.
Understanding Reports
You connected everything, you’re pulling in data, but how do you read it? Where do you find the data to help you answer your business critical questions?
Standard Reports
Standard Reports is a good starting point when you want to know how your website is performing. There’s a lot to unpack here so I’ll only be covering some of the reports.
#1 Real-time Reports
Real-time reports give you insights into how your users are interacting with your website in real time. So if you just launched a campaign and you want to make sure everything is working properly, you can use real-time reports to monitor. Or maybe you want to see the impact of your most recent marketing campaigns and verify the traffic in real time.
#2 Traffic Acquisition Reports
Want to know where your visitors are coming from? Use the Traffic acquisition report to dive into which channels are driving the most traffic, engagement, and conversions. You’ll find metrics (engagement rate, session duration, etc.) that help determine the quality of the traffic as well so you can make more informed decisions around your marketing campaigns.
# 3 Events Reports
GA4 tracks user actions through “events” which is one of the main differences between Universal Analytics (UA) and GA4. UA focused more on session-based tracking while GA4 uses an events-based model.
We can see these events in the Events report. This is where you can see data around your events and what events are driving revenue. There are many use cases but I typically use this report when I’m looking for something specific or debugging.
# 4 Landing Pages Reports
This is a nice report that shows you data about your landing pages. Maybe you want to see data around landing pages you’re using for paid media campaigns and how users are interacting with those pages. This landing page data can be used to provide insights into user behavior and help with Conversion Rate Optimization (CRO) efforts by understanding what’s working and what’s not.
# 5 Tech Details
Use the Tech details section to help you identify which technologies users are using to access your website. The Tech details report is essential for understanding your audience’s device preferences, allowing for the strategic allocation of optimization resources to maximize impact and minimize time spent on platforms that are not as popular.
For example, you might analyze device usage to prioritize mobile or desktop optimization, or dive into engagement metrics to troubleshoot performance issues on specific device types.
While we didn’t go over everything, I hope you found at least one actionable take away or learned something you didn’t know before.
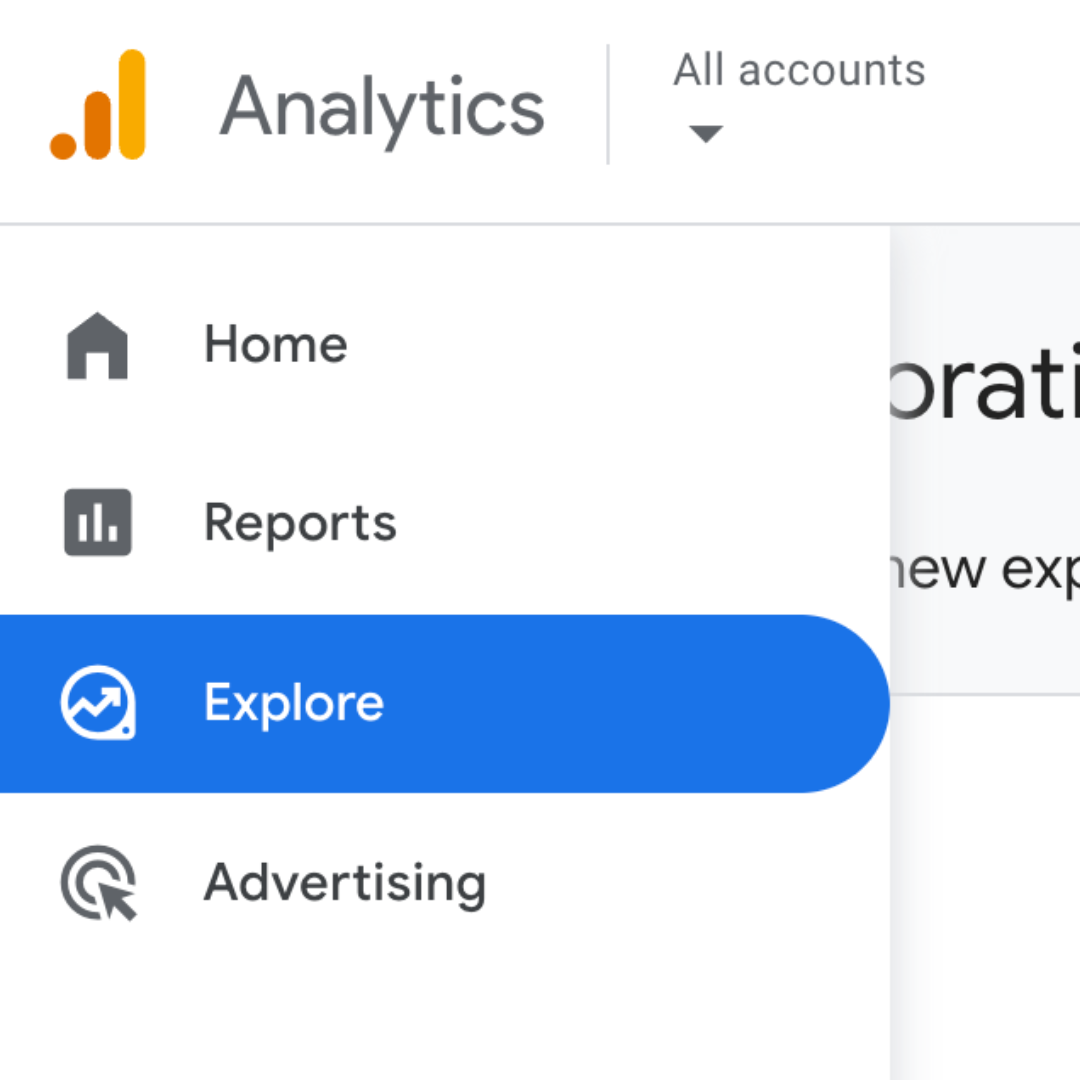
Exploration Reports
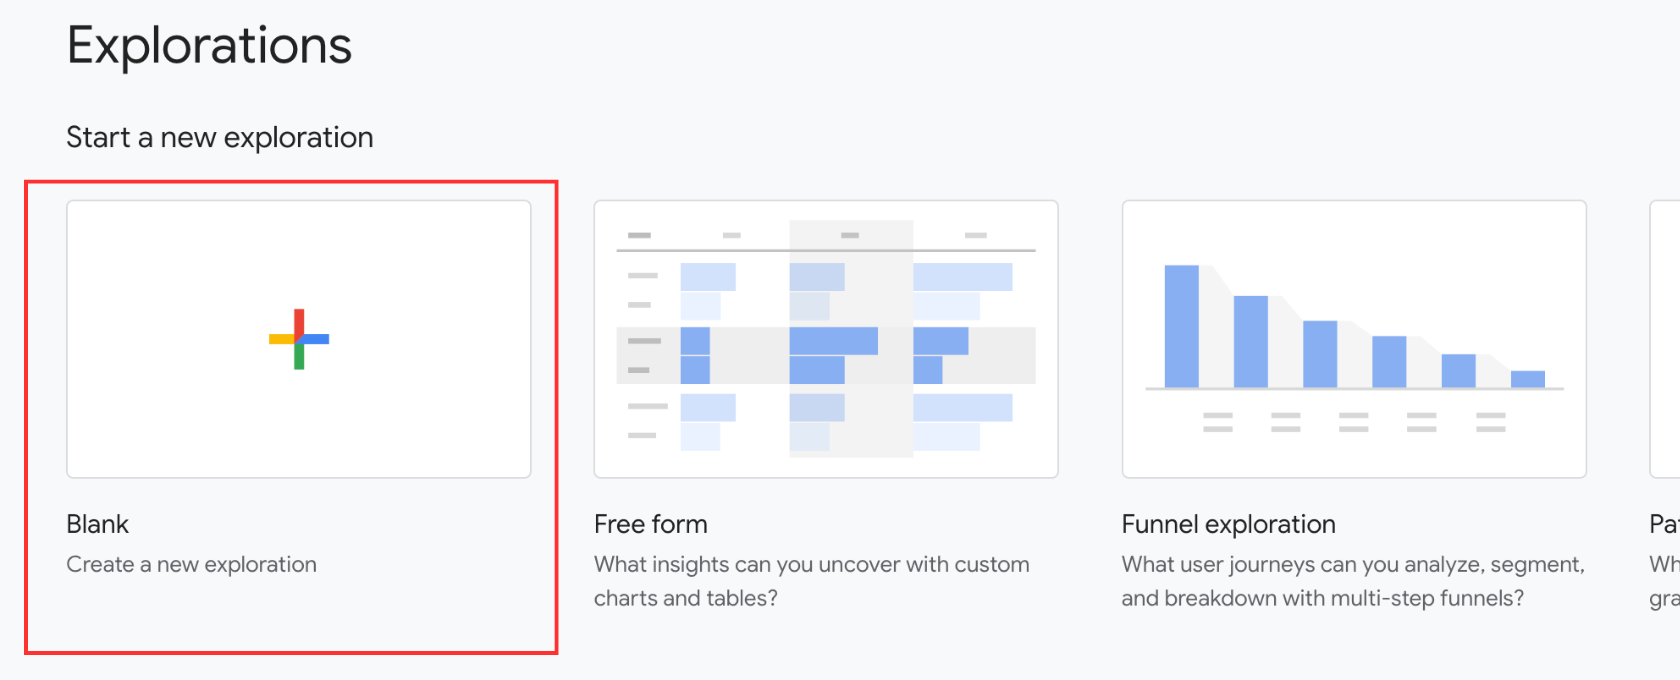
Exploration reports are a good way to dig into your site data and build custom reports. There are templates ready to use but for this example I’m going to use a blank exploration report.
There are a handful of reports ready to use, but for this example I’m going to just use a blank report. Below are some of my preferred templates, but I encourage you to experiment and find what works best for you.
- Blank
- Free form
- Funnel exploration
- Path exploration
 exploration_templates
On the left side of the reporting dashboard you’ll be able to name your report, set a date range, and start pulling in data from Segments, Dimensions, and Metrics.
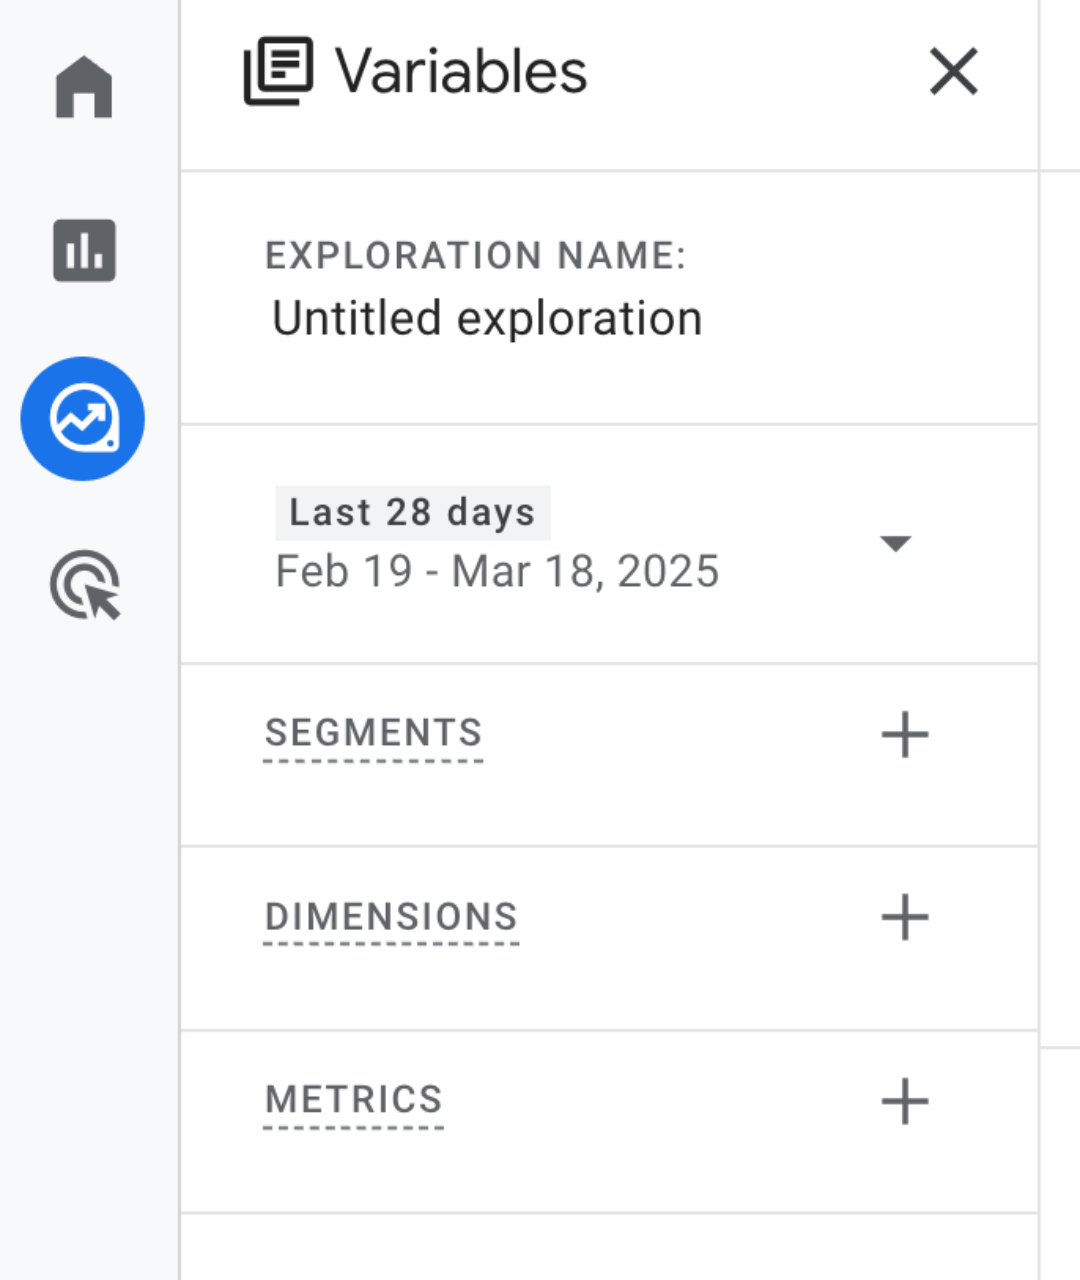
Segments – this is where you can segment your users and view things like users by country, mobile users, paid users, and so on.
Dimensions – this is where you can find answers to common questions like where your users are coming from by using session source/medium.
Metrics – is where you can find things like conversions, event count, and more. Maybe you want to know which channels are bringing in new users and this is where you can do that.
This section could be a whole separate blog so I’m not going to go deep into the weeds here. Just know that if you’re not able to find the data you’re looking for in the Standard Reports section, your next place to look should be in the Exploration Reports.
Event Tracking
All the data we send to Google Analytics are considered events and there are four event categories you should know about.
Automatically Collected Events – these are events automatically tracked when you set up GA4.
Enhanced Measurement Events – these events are collected when you set up GA4 on your website and can be found in the Data Stream section of the admin.
Recommended Events – you should send recommended events with their prescribed parameters/names to get the most details in your reports. Google’s official documentation has a handy list in case you need to reference it.
Custom Events – if you need something more custom that isn’t mentioned in the automatically tracked events, then you can create your own event.
You can name your custom event pretty much anything you’d like following the usual naming convention. For example, if you wanted to call your newsletter_form, form_submission, or newsletter_contact_form that’s acceptable to GA4.
For more information about these categories, I recommend checking out Google’s documentation about events.
Custom Event Example
Here’s how custom event tracking works in Google Analytics 4.
Let’s say I have a website that sells custom t-shirts, hoodies, and other accessories. I noticed our hoodies page hasn’t been getting a lot of visits so I decided to add a hoodies menu item to the navbar.
This is where GTM comes into play!
I added the new menu item but now I want to know how much interaction or how many people are clicking on the hoodies menu item in the navbar.
Since there doesn’t seem to be an event name from Google’s official documentation that fits my use case, I’ll need to create a custom event.
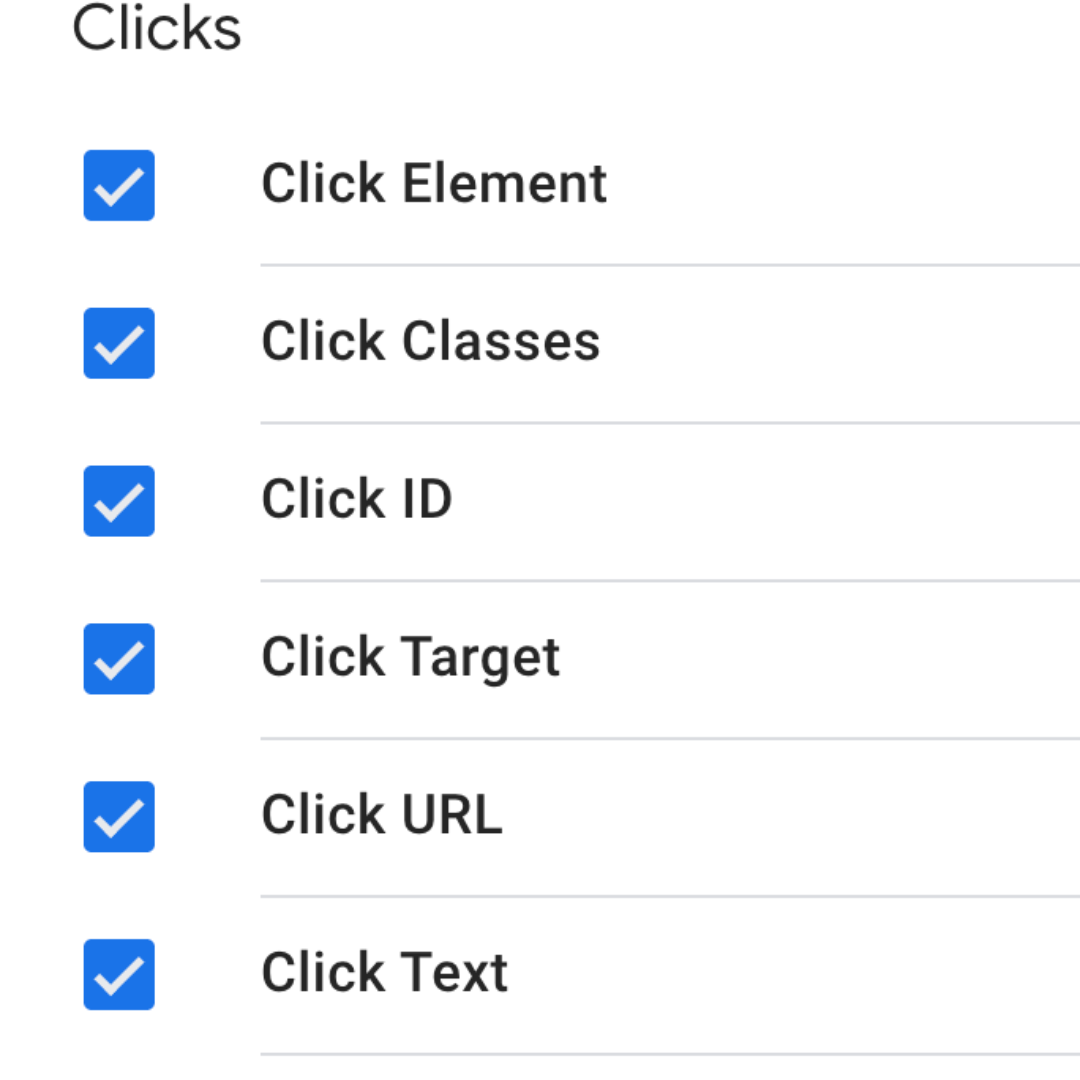
First, in Google Tag Manager, click Variables, click configure, and check all the click variables.
Next, click the Preview button, enter your website, and then once everything is loaded click on the menu item you want to track. In my case, it’s going to be the hoodies menu item in the navbar. You should see there was a Link Click event that fired. Click that and then click the Variables tab.
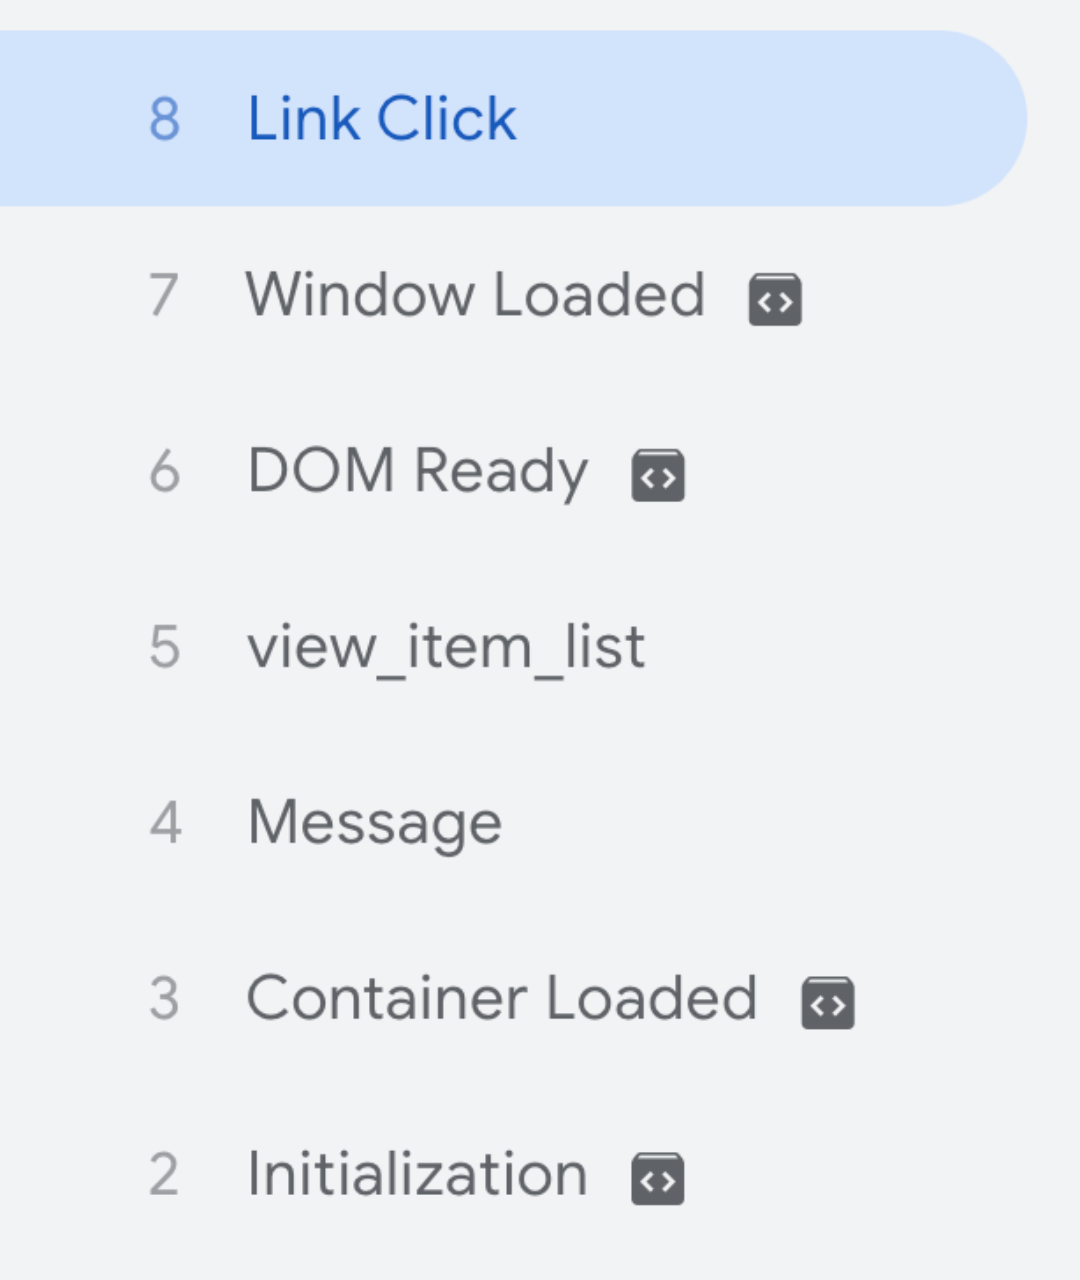
Now we want to look at what we can use as the trigger for our link click because we don’t want to track all link clicks, just a specific one.
Remember when I said to check all the click variables? This is why! We should see all those variables in the variables tab. See if there’s something you can use to identify the clicked menu item. In my case, “hoodies” is a string that’s connected to a Click Text variable so that’s what I’m going to use.
Next, go to the Triggers section in Google Tag Manager and click New.
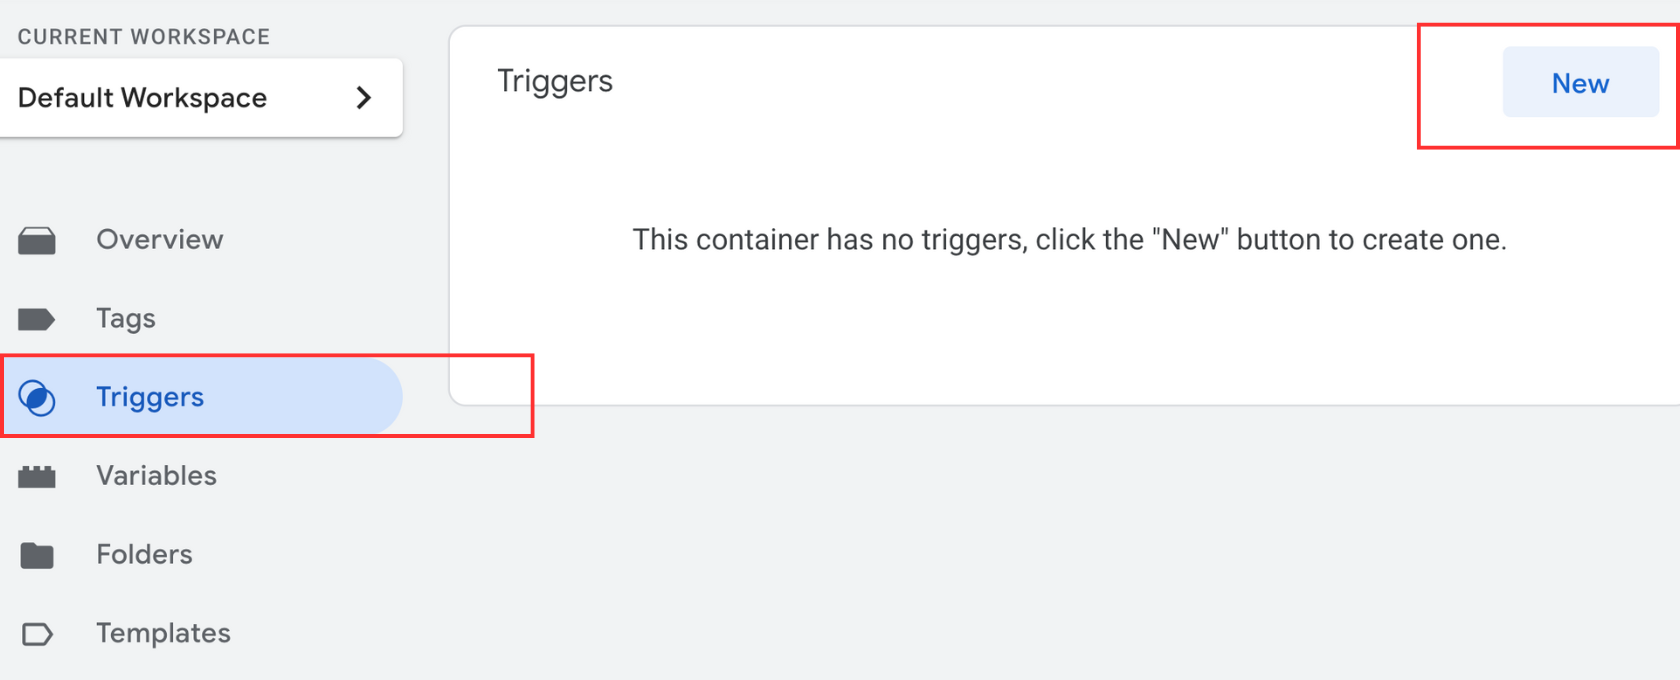
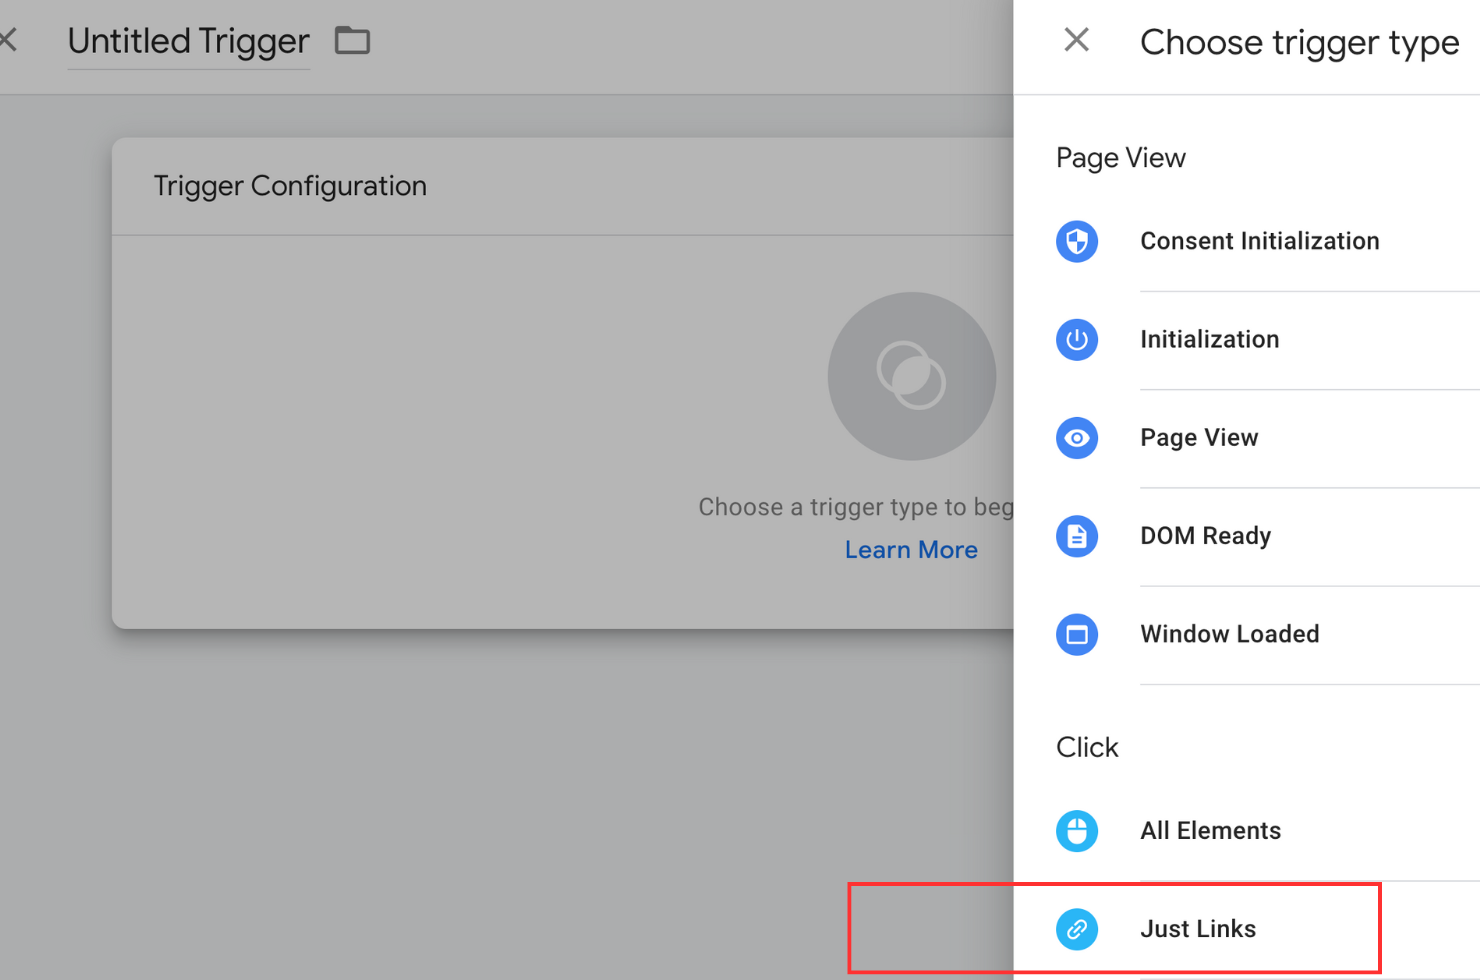
Now click into the box that says Trigger Configuration and select Just Links.
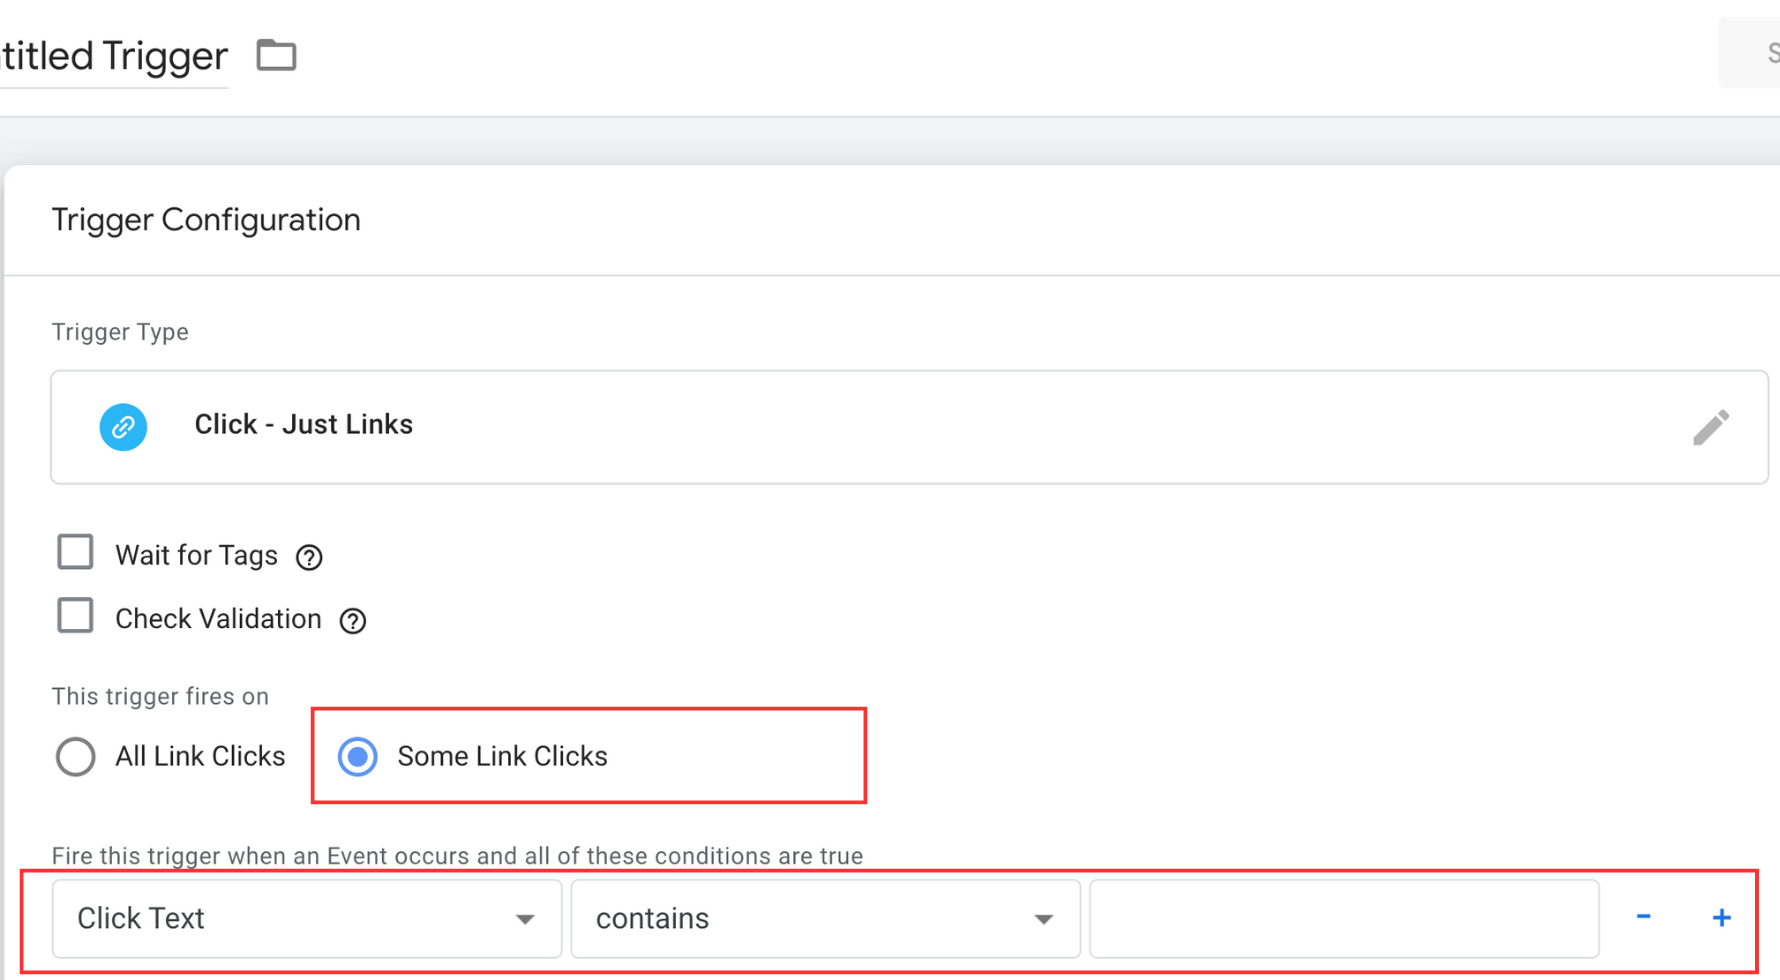
Select Some Link Clicks, choose Click Text (or whatever click variable you decided on), select contains, and add the variable name. Be sure to give your trigger a good name. For me, I like to include as much detail as needed so I can easily identify what it is and its purpose. Save the trigger.
Now we’re ready to create the tag.
- Go to Tags
- Click New
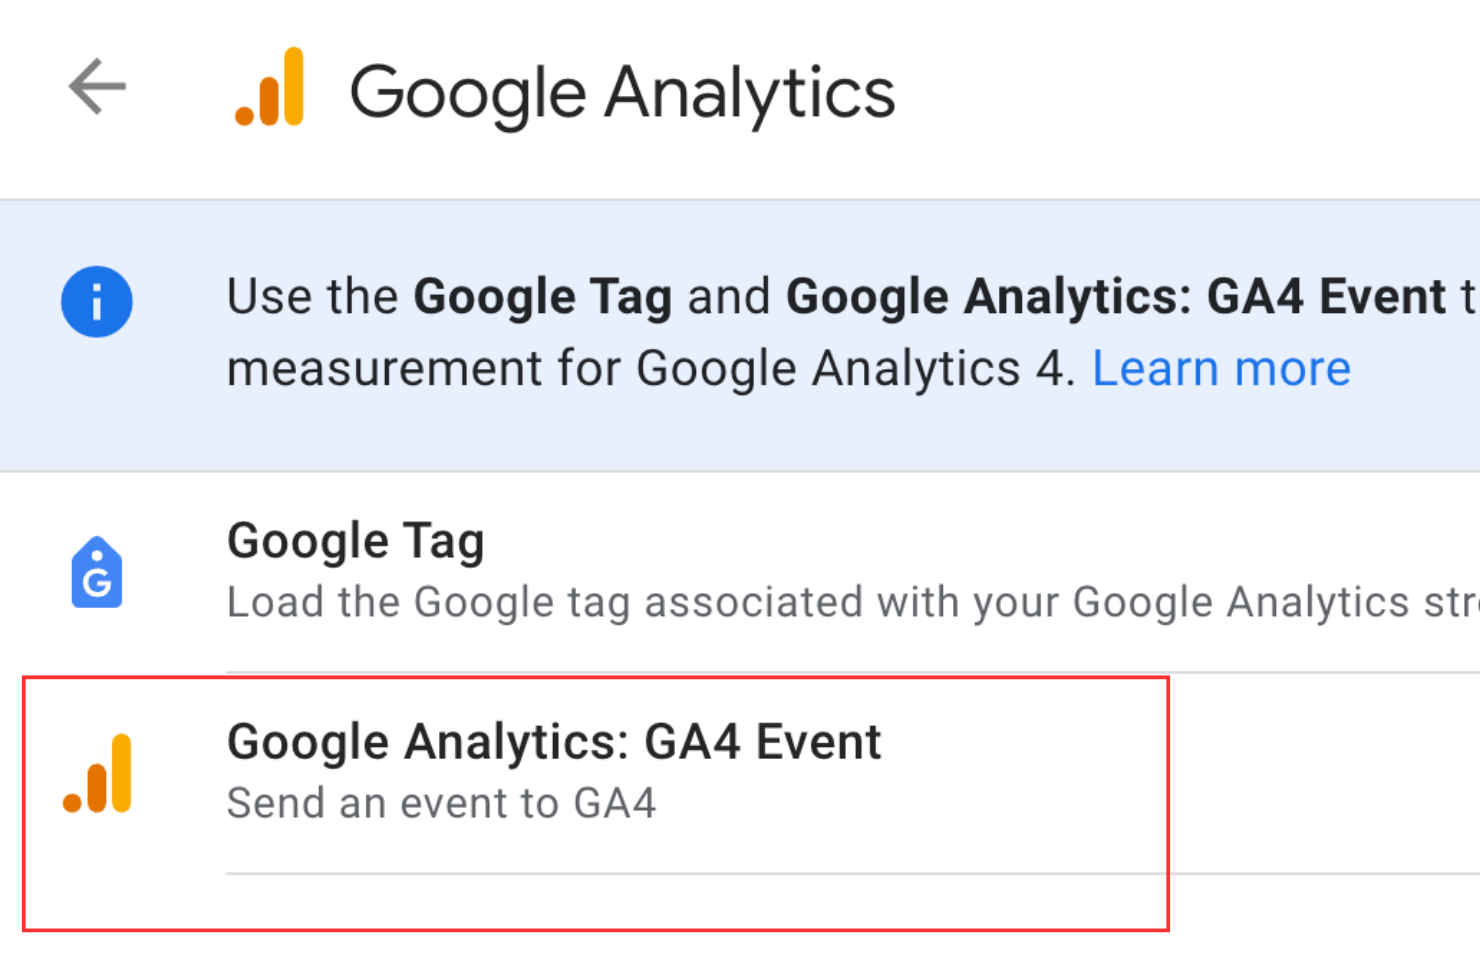
- Click on Tag Configuration
- Select Google Analytics: GA4 Event
- Name your tag
- Add your Measurement ID
- Name your event
Google Analytics: GA4 Event
GTM Tag Configuration

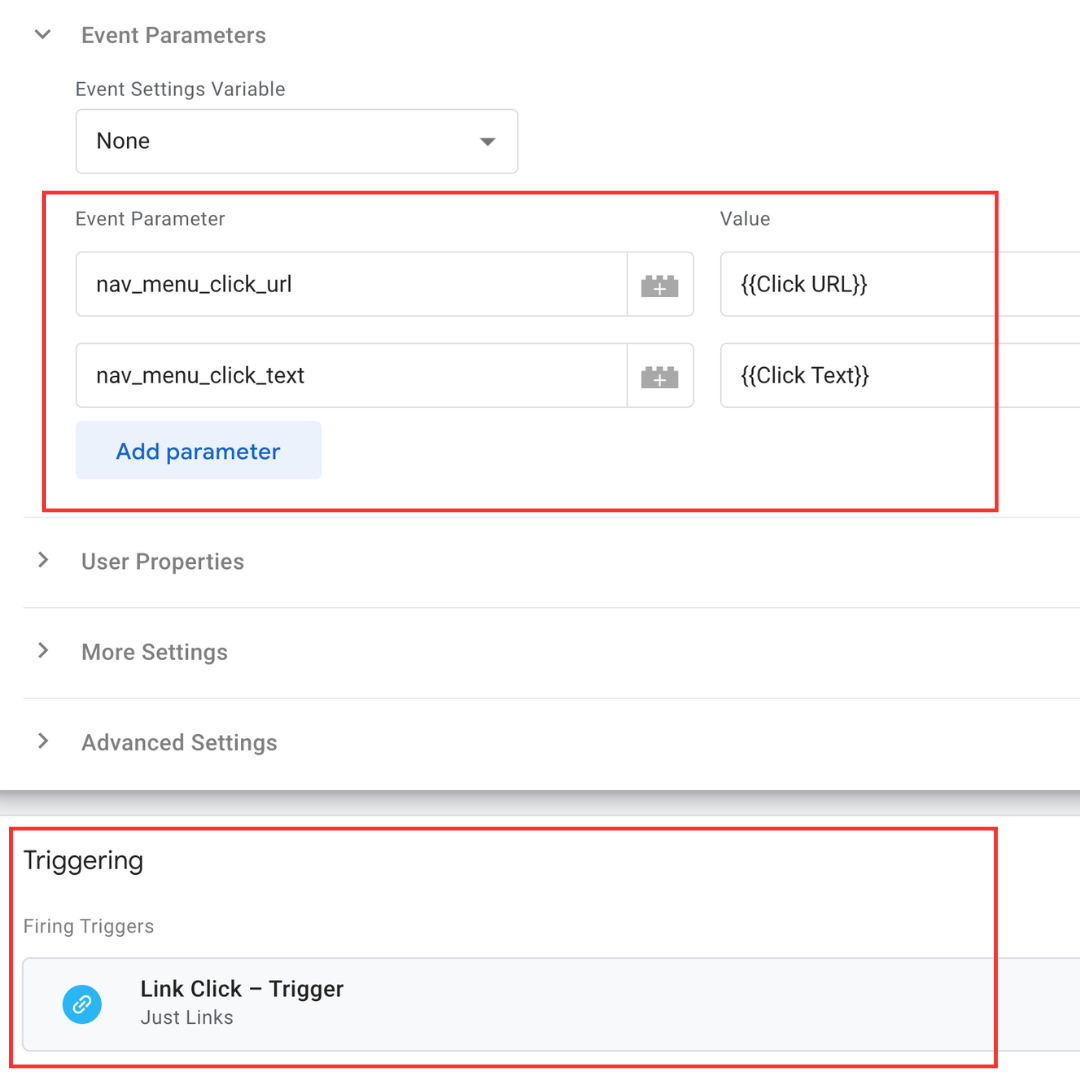
Now, let’s add a couple of event parameters to help us identify that the tracking is pulling in the right data.
- Click Event Parameters
- Add a custom name for the event parameter
- You have the option to send up to 25 event parameters per custom event
- Click the brick icon and search for {{Click URL}}
- Click Add parameter
- Add a custom name
- Click the brick icon and search for {{Click Text}}
- Select the trigger we made before this
- Click Save
Once you’ve saved your tag, it will take you back to your main Workspace. I like to click refresh on my browser just for good measure. There have been times where things didn’t work properly for me but when I hit the refresh button everything seemed to work fine. So I just make this part of my process.
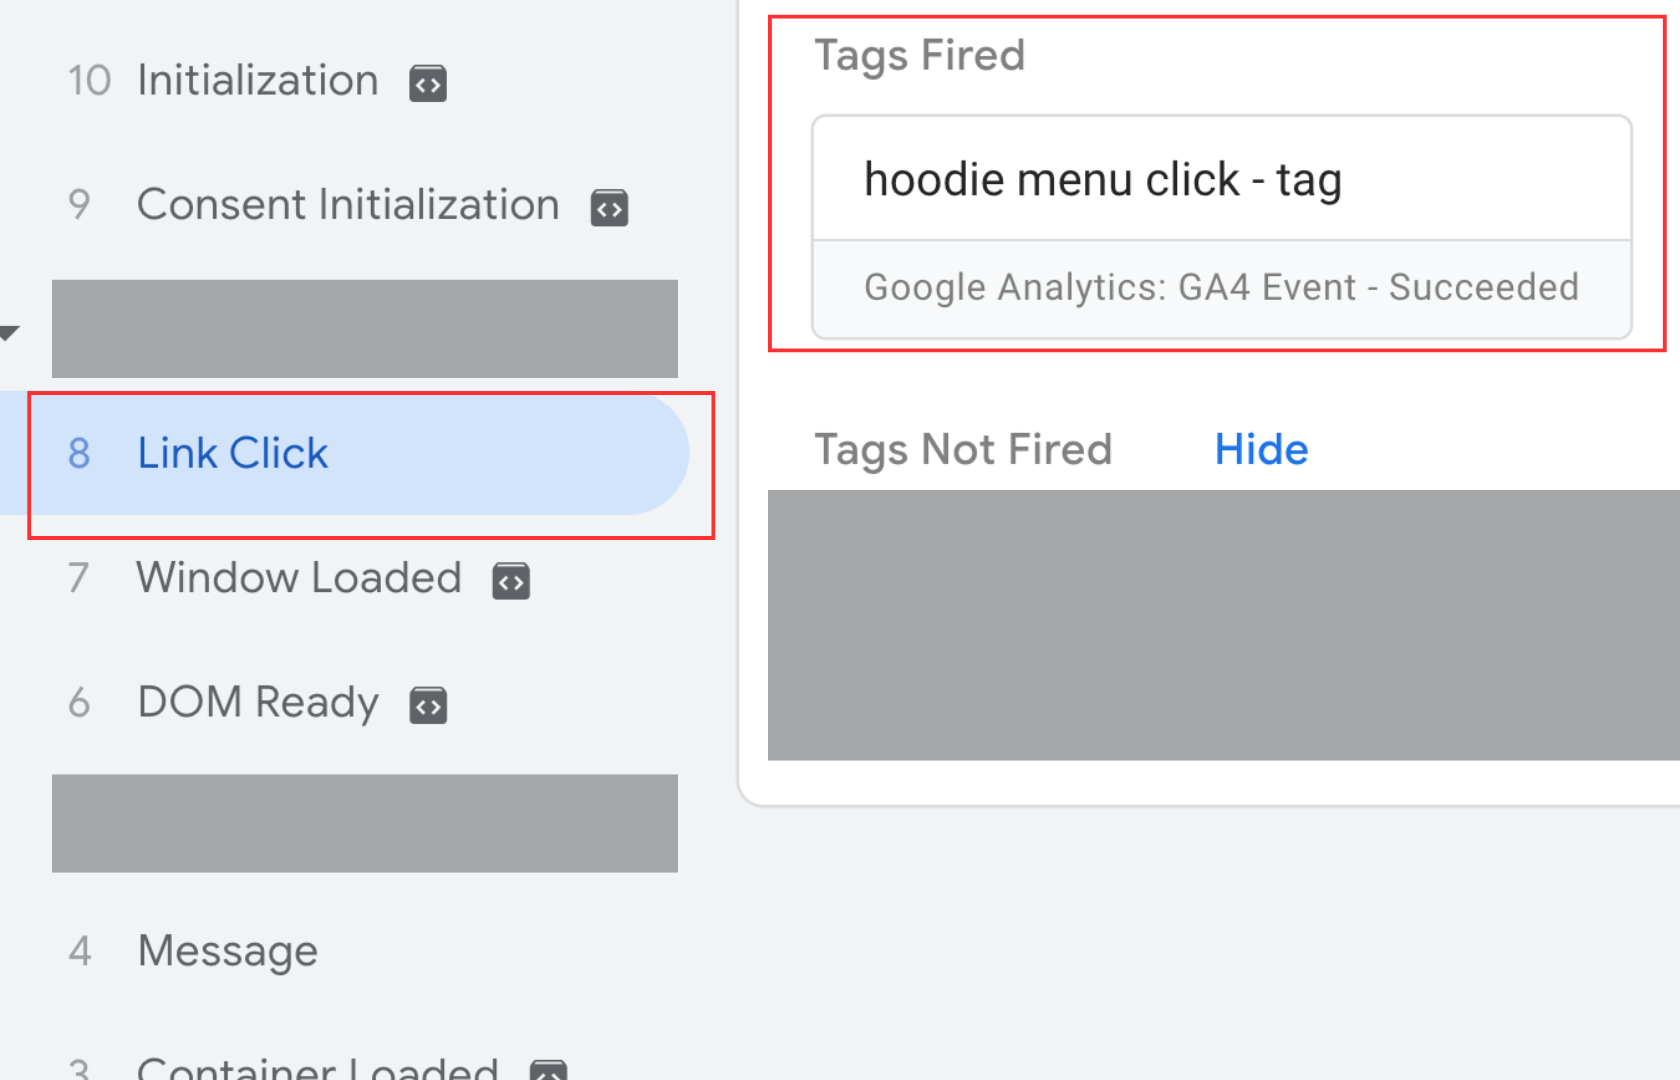
Click Preview and once the site is loaded, click on the menu item you’re tracking. In GTM click on “Link Click” and you should see your tag was fired.
Next, go to the GA4 DebugView and check to see if the custom event name was recorded. When you see your custom name, you can click on it and verify the event parameters you added are pulled through properly.
Register Your Custom Event
The last thing you should do is register your custom event parameters because you can’t actually see it in the GA4 reports, just the realtime reporting.
In the admin, on the left side, click on Custom definitions.

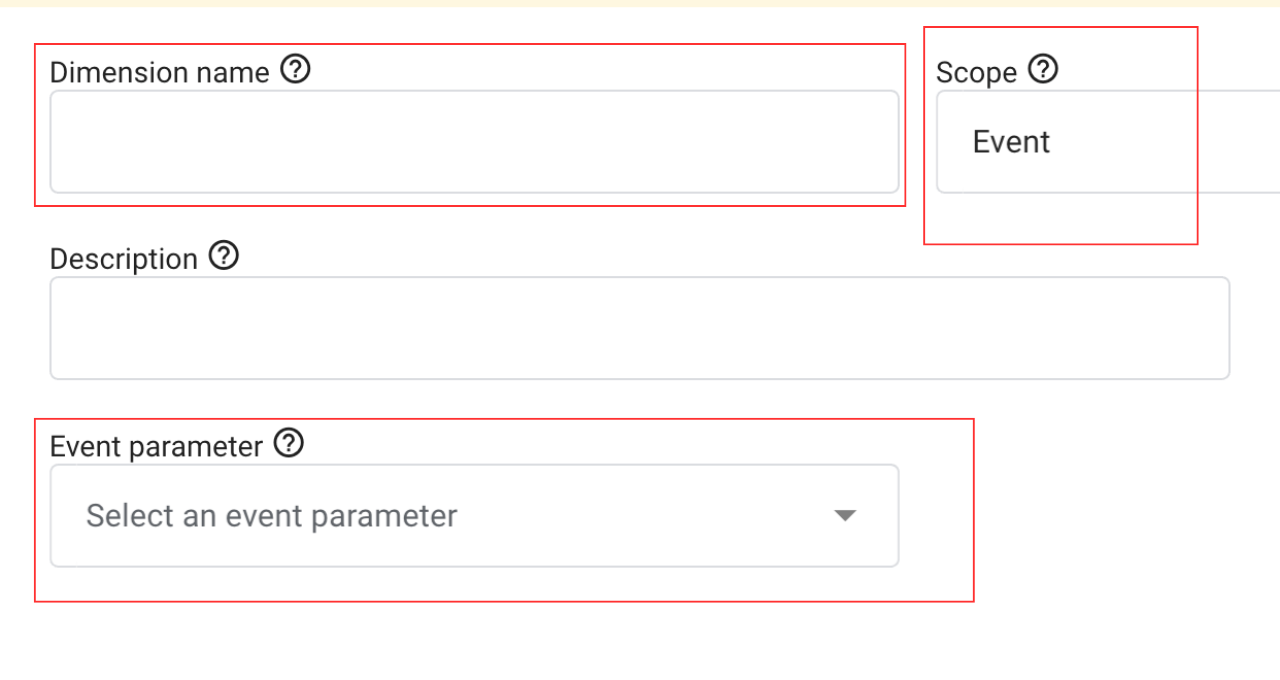
When naming anything, I usually try to be as short and descriptive as possible. If the name ends up being long, then that’s fine as long as it’s easily recognizable or within the naming structure of your organization.
Once you add the name, the Scope should be Event because we want event data, and then add a Description. The description is optional but whenever I have a chance to add a little extra context I like to do so.
For the Event Parameter, you have to type the name of the event parameter exactly like you did in GTM. For example, if you named the parameter test_example_one, then that’s how you need to type it in here. So for me, I would need to type nav_menu_click_url in the Event parameter field and save. I also had a second parameter called nav_menu_click_text so I would need to follow the same process for that.
You’re all set! You should start seeing your data in the Events report within 24–48 hours.
GA4 Use Cases
Stop guessing, start knowing. GA4 provides the actionable insights you need to understand user behavior, enabling you to optimize every marketing touchpoint and drive conversions that directly impact your bottom line. It’s time to turn data into measurable results.
Google Analytics for SaaS
Example 1: Project Management
As a project management tool, maybe your goal as a marketer is to track how many users sign up for a free trial. You can use Google Analytics and Google Tag Manager to help by
- Setting up event tracking for sign-up form submissions
- Create a funnel report to analyze where there’s user drop off during the sign-up journey
- Create and track UTM parameters for your marketing campaigns to see which drive the most sign-ups
Example 2: Monitor User Engagement and Retention
Let’s say you’re marketing SaaS products and you want to know if your users are truly engaging with your core features. This is where data meets discovery, revealing the insights that will redefine your SaaS success.
- Create custom events to track interactions with core features
- Analyze engagement reports to see how much time users spend on the app
- Use the Retention report to measure retention
Example 3: Monitor Churn and Improve Retention
Is your B2B SaaS business seeing a drop in users after 90 days? That sounds like a deep dive into your Google Analytics data is needed.
- Create a funnel analysis in GA4 using built-in events or custom events
- Use the Funnel Exploration report based on the events you define
- Look for stages where users drop off the most and create an audience segment for users at risk of churn
These are just some of the ways you can incorporate Google Analytics into your SaaS marketing strategy.
Google Analytics for Web Development
Example 1: Track and Optimize Lead Gen
If you’re a web development agency and you want to know how many visitors fill out your contact form then GA4 is a good place to start.
- Set up event tracking for form submissions using Google Tag Manager
- Review the submission event in the GA4 reports
- If users are dropping off before filling out the form, create a funnel analysis
Example 2: Monitor Performance and Engagement
Want to understand which pages are truly captivating your potential clients? GA4 provides the detailed insights you need to pinpoint engagement hotspots and strategically optimize your content.
- Track events like pageviews and scroll depth
- Use engagement reports to measure time spent on your services pages
- Review which case studies get the most views
Example 3: Improve Organic Reach
Want to drive more targeted traffic from Google search? GA4 provides the insights you need to optimize your strategy and achieve significant growth.
- Use default channel groups or traffic sources to see how much organic traffic you’re getting
- Connect Google Search Console to you GA4 account and track which queries are bringing in the most traffic
- Set up conversion tracking to measure how SEO and organic search impacts lead generation
Start Tracking with GA4
Whether you’re just starting or a seasoned pro, Google Analytics can be a lot to take in. Don’t feel like you need to remember every little detail in this guide or the official docs. From my experience, the most important thing is to know where to find your most important reports and how to analyze that data. Everything else can be researched with your favorite web browser, YouTube, books, and guides like this one.